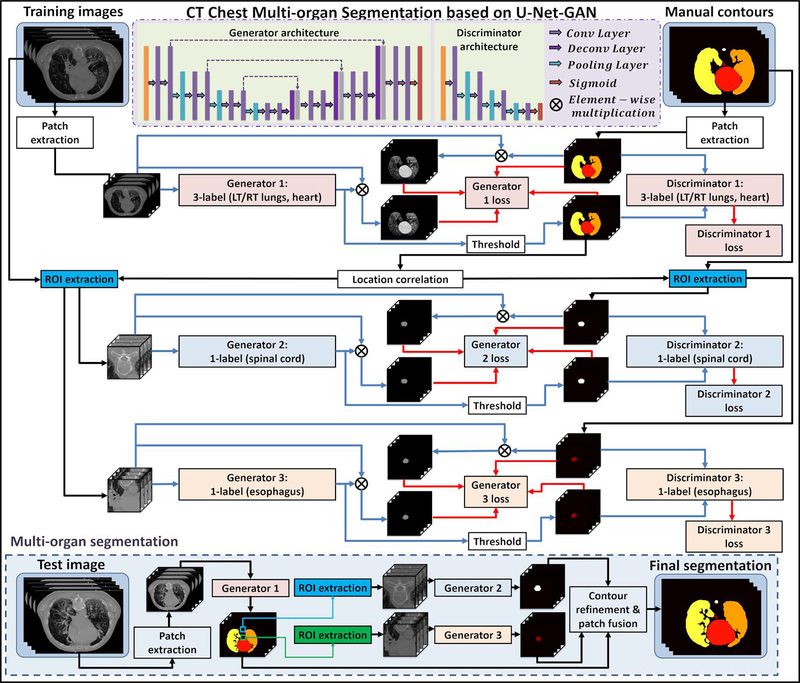
Figure 1.
Schematic flow chart of the proposed algorithm for thoracic CT multi-organ segmentation. The upper part (white) shows the training stage of the proposed method, which consists of three GANs. The lower part (light blue) shows the segmentation stage. In segmenting stage, CT patches are fed into the three well-trained models to get OAR segmentations.

