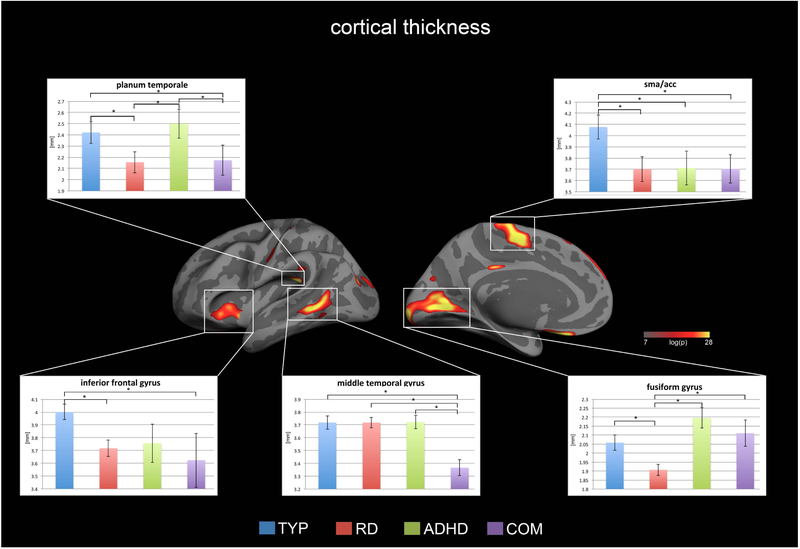
Figure 2.
Displayed are the cortical thickness results for the whole-brain one-way ANOVA with p-values below p<0.05 FDR corrected for multiple comparisons. There were significant group effects only in the left hemisphere, particularly in the reading network and the intersection between the SMA and ACC. Representative bar plots reveal the mean and standard error for each group in key regions. The complete list of results can be found in Figure 4 and Table 2.

