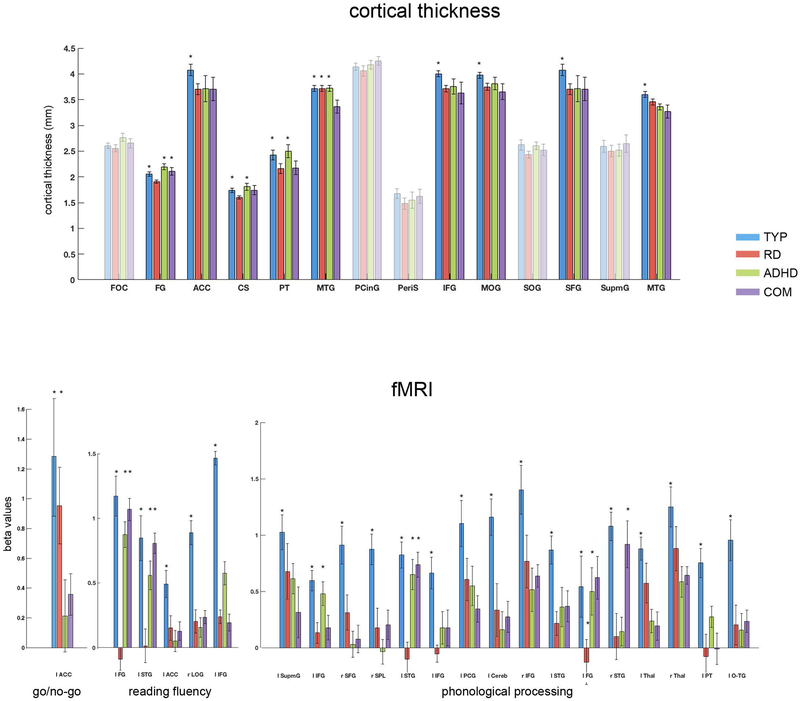
Figure 4.
The post-hoc analysis for the whole-brain ANOVA is illustrated for each imaging task and bar plots are displayed for all significant clusters. The transparent bar plots did not survive the correction for multiple comparisons in the post-hoc t-test analysis. The mean and standard error of the beta values of each group and all significant clusters is displayed. The asterisk indicates increased cortical thickness or brain activation for this group. The exact comparisons can be found in Tables 2-5. Abbrevations: FOC = frontal orbital cortex; FG = fusiform gyrus; ACC = anterior cingulate cortex; CS = central sulcus; PT = planum temporale; MTG = middle temporal gyrus; PCinG = posterior cingulate gyrus; PeriS = sulcus pericallosal; IFG = inferior frontal gyrus; MOG = middle occipital gyrus; SOG = superior occipital gyrus; SFG = superior frontal gyrus; SupmG = supramarginal gyrus; STG = superior temporal gyrus; LOG = lateral occipital gyrus; SPL = superior parietal lobe; PCG = postcentral gyrus; Cereb = cerebellum; Thal = thalamus; O-TG = occipital-temporal gyrus.

