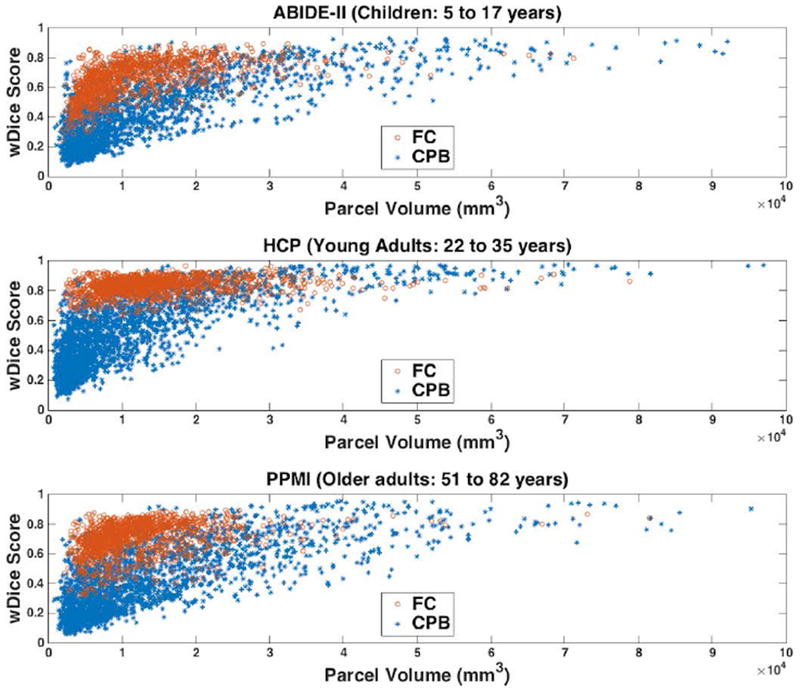
Figure 2.

Volumetric overlap of white matter parcels computed from the test-retest dMRI data using the fiber clustering (FC) and cortical-parcellation-based (CPB) methods. Each plotted point represents one parcel and shows the parcel’s mean wDice score versus the mean parcel volume across all subjects in one dataset. A high wDice score represents a high test-retest reproducibility.
