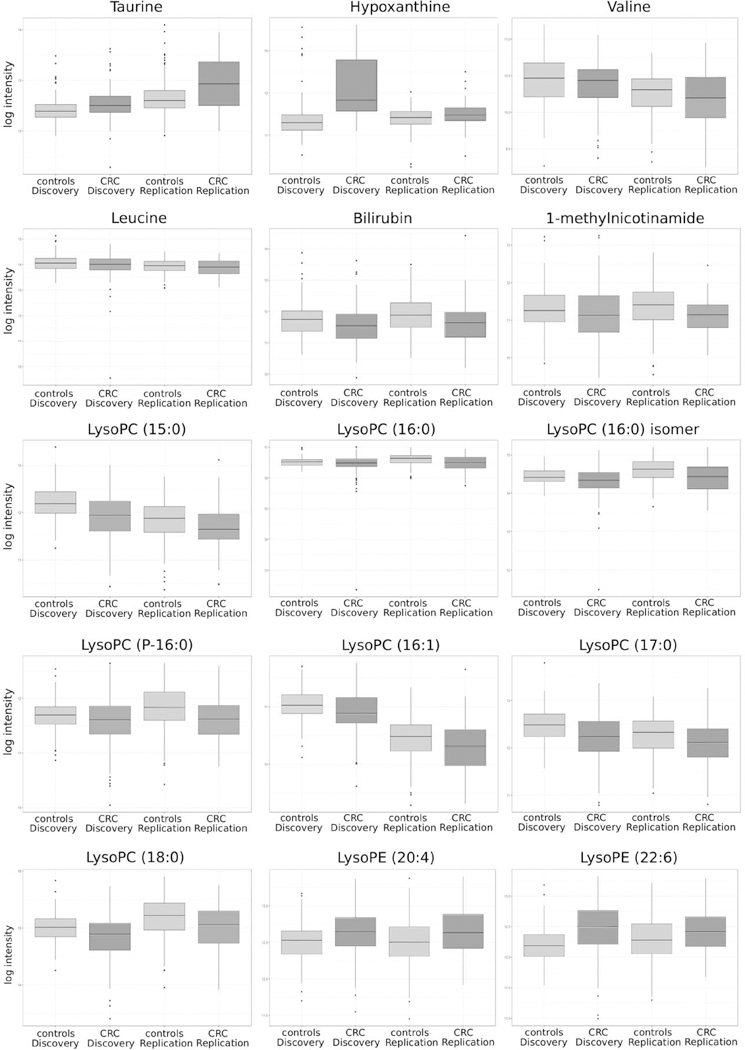
Figure 1.

Box plots of the 15 annotated metabolites differentiating colorectal cancer patients (CRC) and controls for the discovery and replication set. The boxplot presents the minimum, first quartile, median, third quartile and maximum log transformed relative intensity values and potential outliers of taurine, hypoxanthine, valine, leucine, bilirubin, 1- methylnicotinamide (MNA), LysoPC (15:0), LysoPC (16:0), LysoPC (16:0) isomer, LysoPC (P-16:0), LysoPC (16:1), LysoPC (17:0), LysoPC (18:0), LysoPE (20:4) and LysoPE (22:6), respectively.
