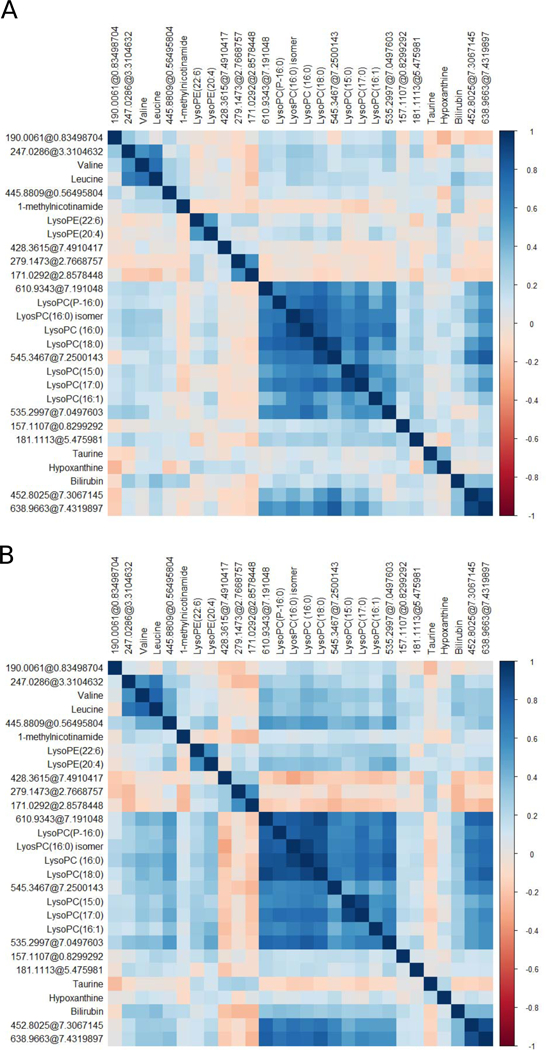
Figure 2.

Metabolite-metabolite correlation analysis of replicated metabolites. Positive correlations are highlighted in blue, negative correlations are highlighted in red. Unknown compounds are indicated as monoisotopic mass@retention time. Metabolites are ordered by hierarchical clustering. (A) Spearman correlation analysis plot of the discovery dataset. (B) Spearman correlation analysis plot of the replication dataset.
