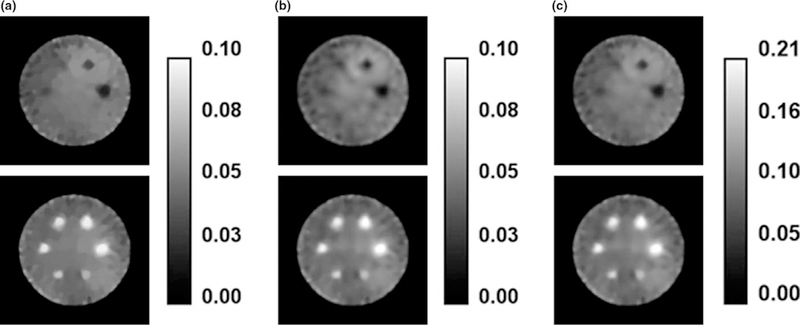
FIG. 3.

Components of the ICTV-PAPA-reconstructed images obtained at 100 iterations for simulated SPECT data with 120 kc/view, λ1 = 0.2, and λ2 = 0.2: (a) f1 component, (b) f2 component, and (c) final combined image (f = f1 + f2). Top row: cold spheres with zero activity. Bottom row: hot spheres with Gaussian activity distribution (see Fig. 1 and text).
