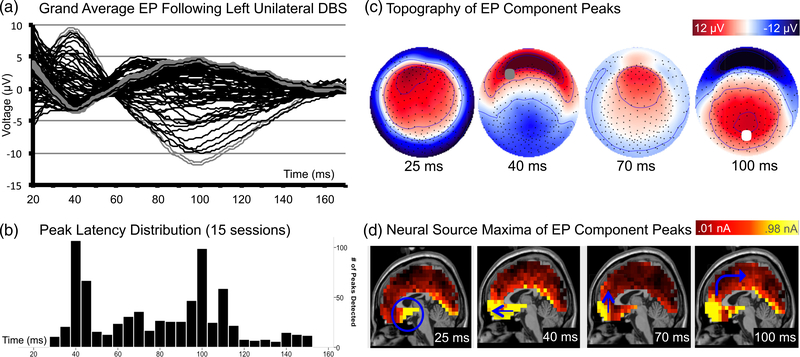
FIGURE 1.
Cortical response to unilateral stimulation of the left subcallosal cingulate. (a) Grand average of recorded voltages in the 10–10 array (n = 4; 15 sessions) following stimulation from left lead. Gray traces show maximum voltage at FP1 (bold) and Pz (hatched). x-axis = time (ms); y-axis = amplitude (μV). (b) Distribution of peak latencies (from 15 sessions). (c) Topography of grand average scalp voltages following stimulation from left lead at peak maxima/minima. Topography shown as if looking down on the head surface with nose oriented to the top of the page. Saturated color indicates higher amplitude (red = positive; blue = negative). Gray circle at 40 ms indicates channel FP1; and white circle at 100 ms indicates channel Pz. (d) Neural source model of grand average at peak latencies, including: the locus of stimulation in the SCC (blue circle), mesial temporal lobes and mesial temporal pole (25 ms); anterior ventral medial and orbital frontal dipoles (40 ms); frontal medial BA10 (70 ms); anterior ventral dipoles, including SCC, orbital, and medial frontal pole (100 ms), relative contribution of PCC is maximal at 100 ms (blue arrow)

