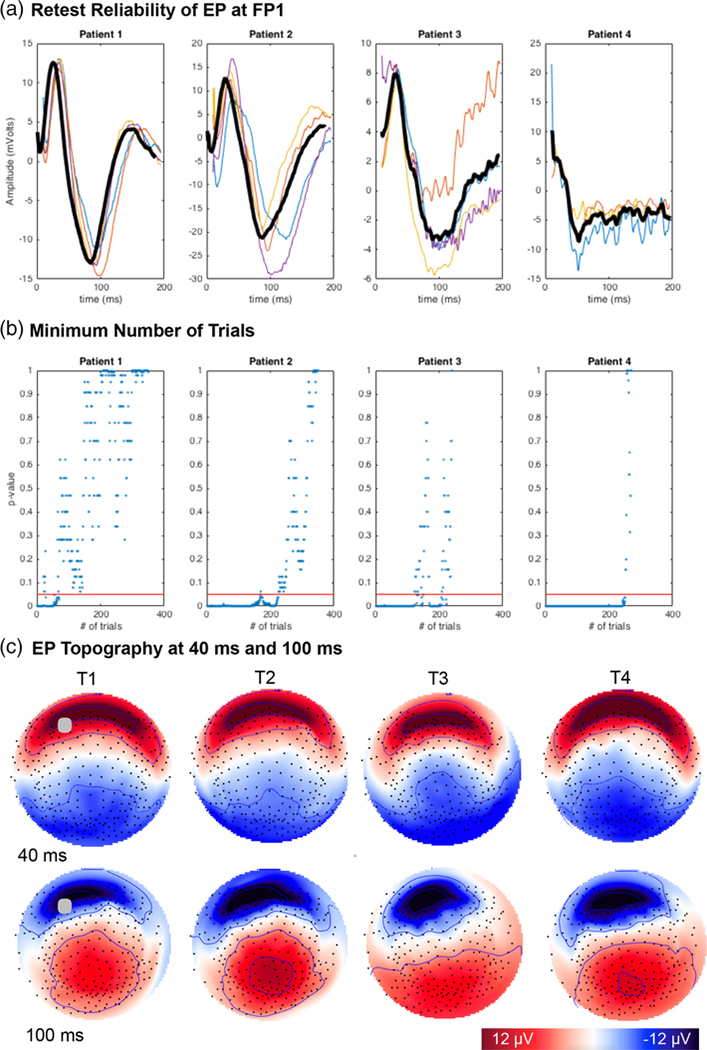
FIGURE 3.
Reliability of the SCC DBS evoked response. A. Repeated measures in four patients shown at channel FP1. Patient-level average across recording sessions shown in bold. Single session averages: T1 (blue), T2 (red), T3 (orange), T4 (yellow). x-axis = time (ms), y-axis = amplitude (μV) B. Minimum number of trials (<250) to derive a consistent signal in individuals. x-axis = # of trials, y-axis = K-S test result, red line indicates p = .05. C. Topography of patient 1 scalp potentials at 40 ms (row 1) and 100 ms (row 2). Results shown for each of four sessions (columns). Topography shown as if looking town on the head surface with nose oriented to the top of the page. Saturated color indicates higher amplitude (red = positive; blue = negative). Gray circle at T1 indicates location of channel FP1

