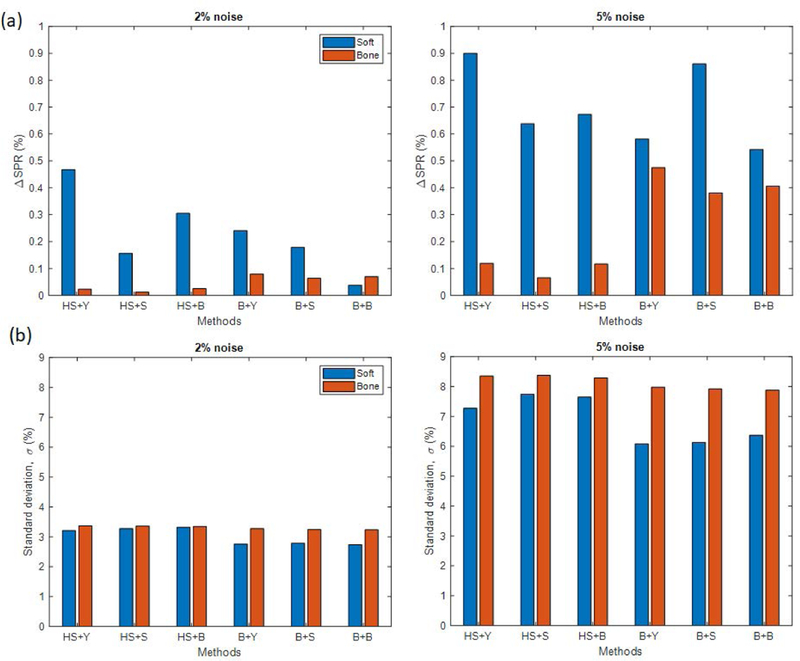
Figure 10.
Comparison of (a) SPR mean shift (ΔSPR) and (b) variation of SPR when using different combinations of methods for the calculation of ρe and Z (Hunemohr-Saito (HS) and Bourque (B)) and the conversion of Z-to-I (Yang (Y), Saito (S) and Bourque (B)). Two different noise levels (2% and 5%) were applied to both HUL and HUH. CT numbers from 2000 individualized human tissue samples were used.

