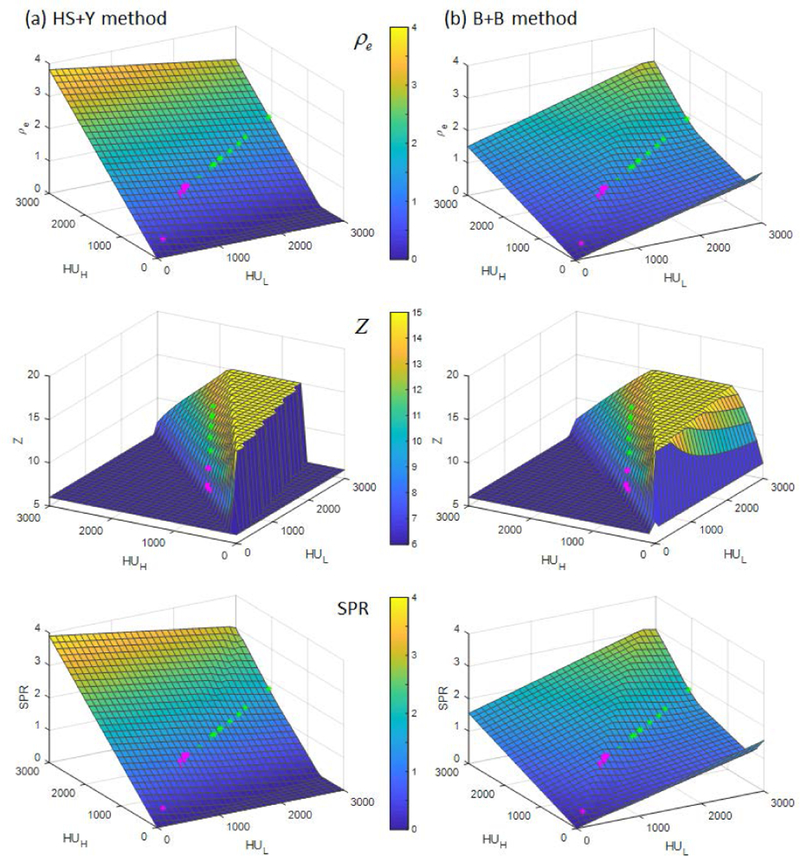
Figure 3.
ρe, Z, and SPR of (a) the HS+Y method and (b) the B+B method with all the possible combinations of CT numbers within [0, 3000] with grid size of 100. Magenta and green asterisks represent soft tissues and bone tissues, respectively, selected from ICRU 44 (Table 2). Note that all negative or complex values were forced to zero and Z was regularized to [6, 15] to avoid unrealistic values.

