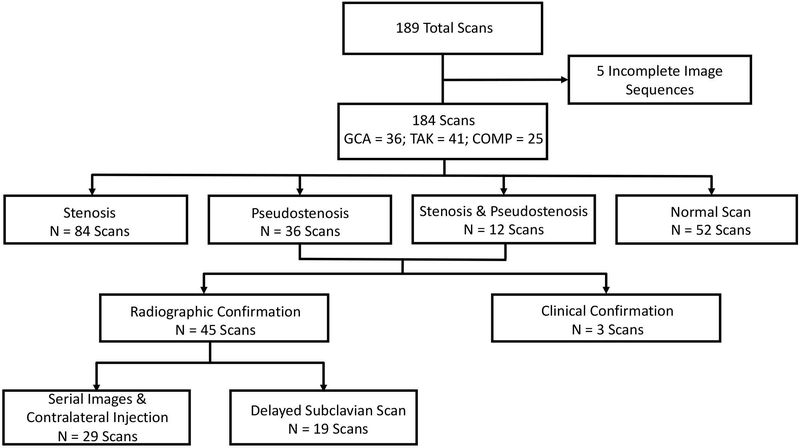
Figure 1. Flow Chart of Radiographic Cohort.
184 MRA studies were analyzed for stenotic lesions throughout the subclavian and axillary arteries. N represents the number of scans analyzed; GCA = giant cell arteritis; TAK = Takayasu’s arteritis; COMP = comparator group consisting of healthy controls and patients with other vasculopathies.

