
Figure 1. Rituximab treatment triggered transient changes in whole blood gene module expression.
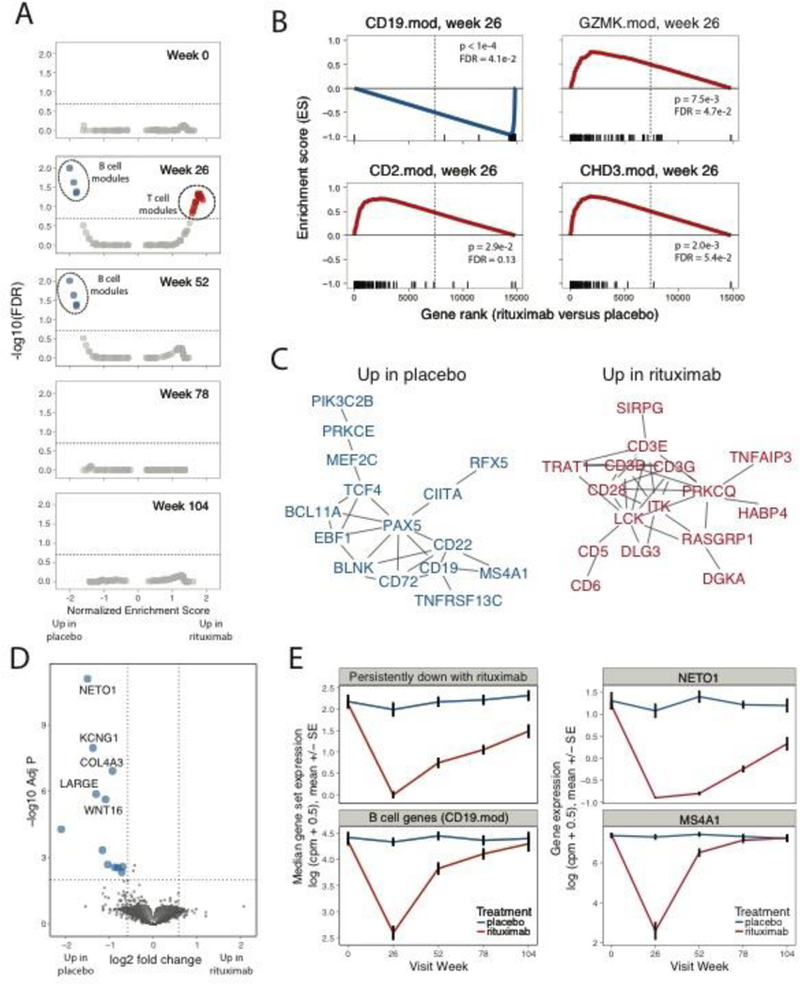
(A-B) GSEA (12) comparing rituximab- to placebo-treated patients. (A) Under/over-representation of specific gene sets in whole blood signatures from rituximab-treated individuals over the course of the study. Horizontal line indicates FDR of 0.20. Statistical tests were performed using the GSEA tool (http://software.broadinstitute.org/gsea/downloads.jsp). Blue, over-expressed in Placebo-treated subjects; Red, over-expression in rituximab-treated subjects. This analysis included 30, 28, 30, 27 and 20 rituximab-treated subjects at the 0, 26, 52, 78 and 104 week visits, respectively; and 13, 10, 12, 15 and 8 placebo-treated subjects at the same visits. (B) Selected gene sets (modules) significantly under/over-represented in rituximab-treated individuals at Week 26. X axis, enrichment score; Y axis, gene rank in rituximab- versus placebo-treated samples. Rug plots along the X-axes show differential expression ranks of module genes relative to all genes. (C) STRING network (14) of PPI interactions among genes in the leading edge of gene sets significantly up-regulated in rituximab-treated patients at Week 26. Shown are network graphs representing the unions of genes found multiple down- or up-regulated modules (>1 or >4, respectively). To minimize the size of the graph, vertices (genes) were filtered to have degrees (number of adjacent connections or edges) >1 and to represent vertices not farther than 3 connections from another fixed vertex (neighborhood). Vertices are colored as in Figure 1A. Vertex sizes are proportional to the rank of regulation shown in the rug plots in Figure 1B. D) Differential expression of genes between the placebo- and rituximab-treated patients at the 78 week visit, performed using limma-voom (17). Left, Horizontal dotted line represents FDR=0.01, vertical dotted lines represent fold change of +/− 1.5; Center, expression of module gene sets; Right, expression of representative individual genes over time in placebo-treated patients. Upper panels show genes persistently down-regulated with rituximab treatment, lower panels show B cell module genes (CD19.mod) and an established individual B cell marker gene, MS4A1 (CD20). There were N = 13 placebo and N = 30-rituximab-treated subjects tested at week 0, respectively; and N = 15 placebo and N = 27 rituximab treated subjects at week 78. Values are means across patients; error bars show +/− 1 standard error of the mean.