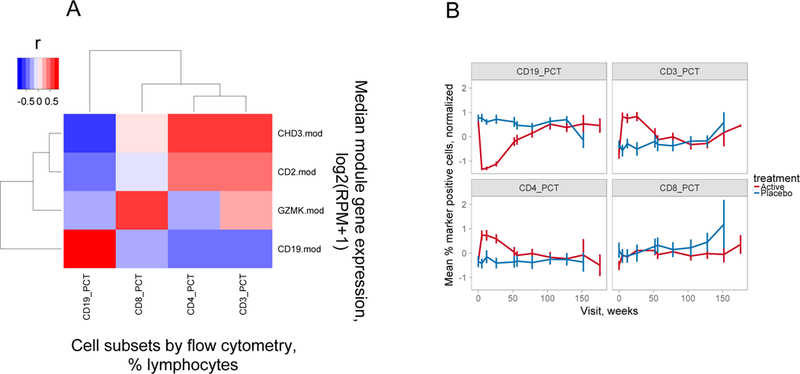
Figure 2. Flow cytometry also demonstrates over-expression of T cell genes in rituximab-versus placebo-treated subjects.

A) Correlation of modular gene expression with cell subset levels determined by flow cytometry. Shown is a heatmap representation of the correlation between modular gene expression measured by RNA-seq (Y axis) versus the percentages of cell subsets determined by flow cytometry (X axis). Gene expression was calculated as median log2 expression values in reads per million (RPM) +1 for all genes in the indicated module. Cell subsets were determined by antibody staining and were expressed as percentages of total lymphocytes (31). The magnitude of Pearson’s correlation coefficients (r) are represented by color intensity; Red, positive correlation; Blue, negative correlation. This plot was derived from 27 rituximab-treated subjects tested at week 26. B) CD3+ and CD4+, but not CD8+ T cell subsets were transiently overexpressed in rituximab-treated subjects. Percentages of the indicated cell subsets for all subjects at each visit were normalized by z-scores (value- mean of values)/SD of values). Shown are the z-score normalized mean percentages of the indicated cell subsets (+/− SD, Y axis) determined by flow cytometry (31) versus time of visit (X axis). There were 30–35 rituximab- versus 14–17 placebo-treated subjects tested at weeks 0–104 for each marker; and 25, 4 and 2 rituximab- versus 12, 2 and 1 placebo-treated subjects at weeks 128–176.
