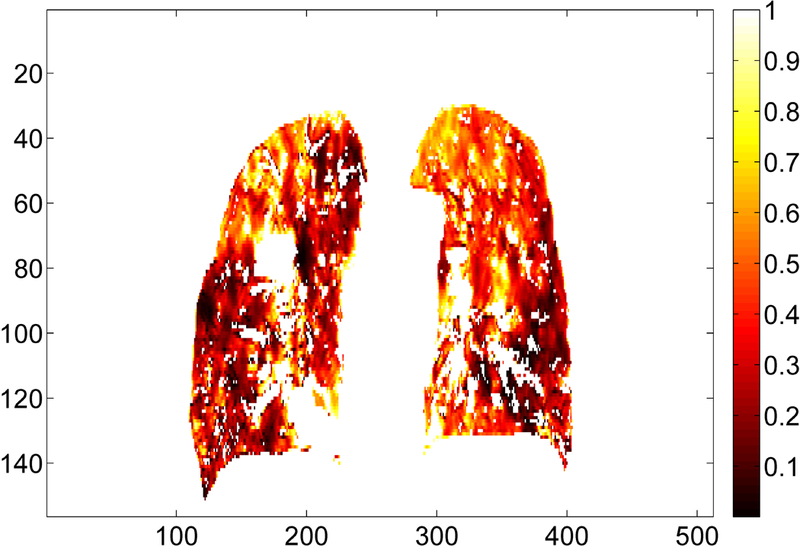
Figure 2.

Illustration of the Jacobian map inside the lung for one representative patient (Patient 3 from Table 1) in coronal view. The deformation vectors are from the deep inspiration breath hold CT to the end of exhalation CT. All the Jacobian values are less than 1, indicating a volume shrinkage. Jacobian values for the tumor and the high-density vessels are excluded from this illustration.
