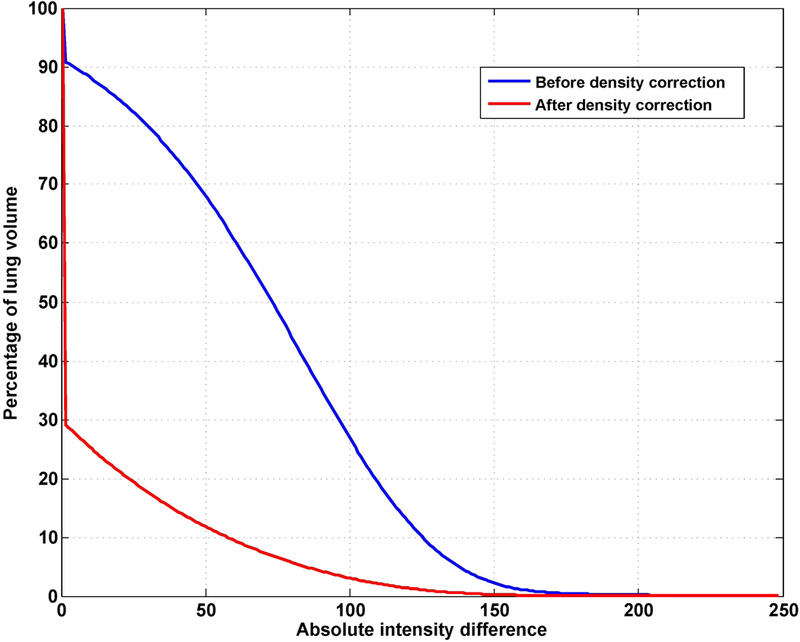
Figure 4.

Cumulative histogram of absolute intensity differences between the DIBH CT and deformed EE CT inside the lung for the patient shown in Figure 3. The error after density correction (red line) is significantly reduced compared with the error before density correction (blue line).
