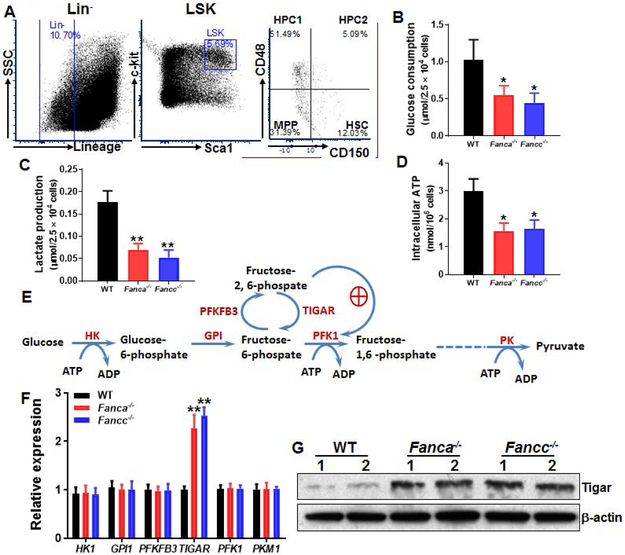
Fig 1. Reduced glycolysis in FA HSCs.
(A) Gating strategy for FACS sorting. (B) Reduced glucose consumption in FA HSCs. SLAM (Lin−Sca-1+c-Kit+CD150+CD48−) cells from the bone marrow (BM) of Fanca−/−, Fancc−/− and wild-type (WT) mice were isolated by FACS sorting and subjected to analysis for glucose consumption analysis. (C) Reduced lactate production in FA HSCs. SLAM cells described in (B) were analyzed for lactate production (C). (D) Lower ATP levels in FA HSCs. Relative intracellular ATP concentrations were measured in cells described in (A). Results depicted in B-D are means ± SD of three independent experiments. (n=6-9 per group). (E) Schematic presentation of glycolytic pathway. (F) Expression of the genes encoded for the key enzymes of the glycolysis pathway in WT and FA HSCs. RNA were extracted from SLAM cells described in (A) followed by q-PCR analysis for the indicated genes using primers listed in Supplementary Table S1. Samples were normalized to the level of GAPDH mRNA. (n=6-9 per group). (G) Increased TIGAR protein in FA HSPCs. Whole cell lysates (WCLs) were extracted from 30,000 LSK (Lin−Sca1+c-kit+) cells isolated from WT, Fanca−/− and Fancc−/− mice followed by immunoblotting using antibodies against TIGAR or β-actin. *, p<0.05; **, p<0.01.

