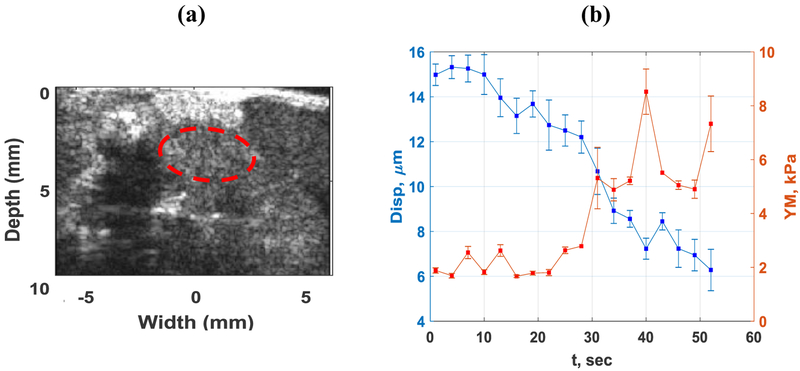
Figure 5.
(a) High resolution B mode image of PDA Tumor and surrounding organs of the first in vivo mouse study using L 22–14 V probe. The tumor is specified with a dashed red oval shape, (b) The absolute peak-to-peak displacement and Young’s modulus temporal profiles of tumor, red dashed oval, in part (a) of this figure during HIFU application for 54 seconds.

