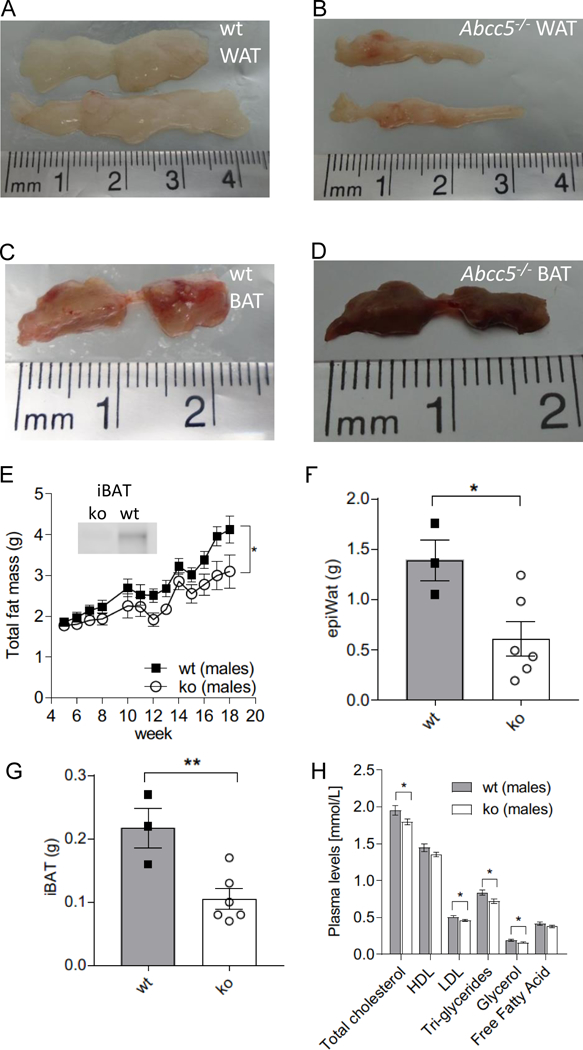
Figure 3. Male brown adipose tissue (BAT) and white adipose tissue (WAT) depots.

(A) Representative image of wild type (wt) epididymal WAT (epiWAT). (B) Representative image of Abcc5−/− (ko) epididymal WAT (epiWAT). (C) Representative image of wt interscapular BAT (iBAT). (D) Representative image of Abcc5−/− interscapular BAT (iBAT). (E) Total fat mass. Each data point represents mean±SEM. Changes in total fat mass over time for Abcc5−/− vs wt was analysed by two-way ANOVA with a Bonferroni post-hoc test, *P≤0.05. The insert shows Western blot analysis of ABCC5 protein expression in adipose tissue. Lanes 1 and 2, interscapular BAT (iBAT) for male Abcc5−/− and male wt mice respectively. (F) Mass of epiWAT and (G) mass of iBAT; wt, n=3, Abcc5−/−, n=6 animals. (H) Lipid plasma levels for male Abcc5−/− mice (n=15) and male wt mice (n=15). Data shown as mean±SEM; Welch’s unequal variances t-test, *P<0.05, **P<0.01.
