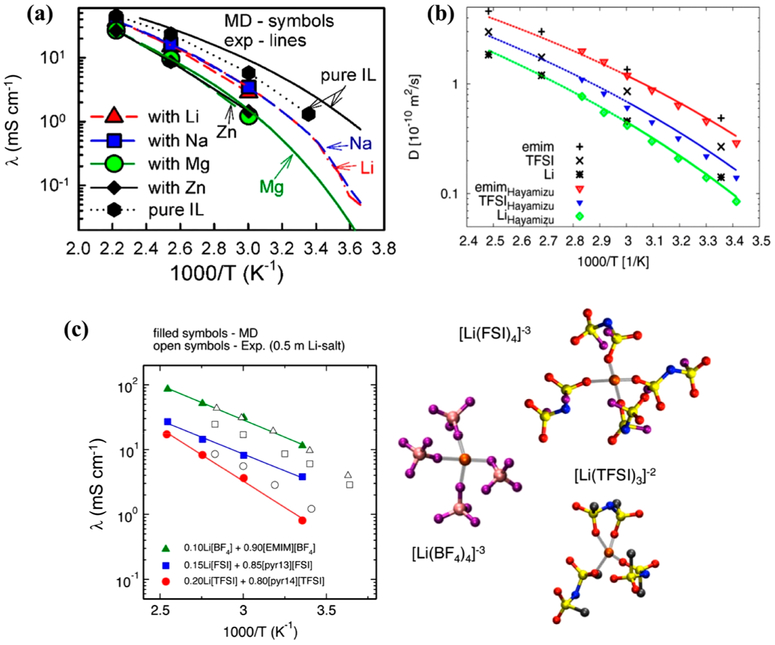
Figure 24.
(a) Conductivity from the MD simulations (symbols) and experimental data (lines) of [Pyr14][TFSI] doped with LiTFSI, NaTFSI, Mg(TFSI)2, and Zn(TFSI)2 salts at metal:Pyr14 = 1:4 ratio.367 Reprinted from ref 367. Copyright 2018 American Chemical Society. (b) Diffusion coefficients for [C2mim][TFSI] + LiTFSI with C2mim:Li = 10.6 ratio from MD simulations368 shown as black symbols, lines represent the Vogel–Tamman–Fulcher fit to experimental data,368 the colored symbols show the diffusion coefficients determined by Hayamizu et al.369 for m = 0.32 mol kg−1. Reprinted from ref 368. Copyright 2014 American Chemical Society. (c) Ionic conductivity of [C2mim][BF4] and [Pyr14][TFSI] ILs doped with Li salts and snapshots of representative solvates from MD simulations using APPLE&P force field.370 Reprinted from ref 370. Copyright 2014 American Chemical Society.

