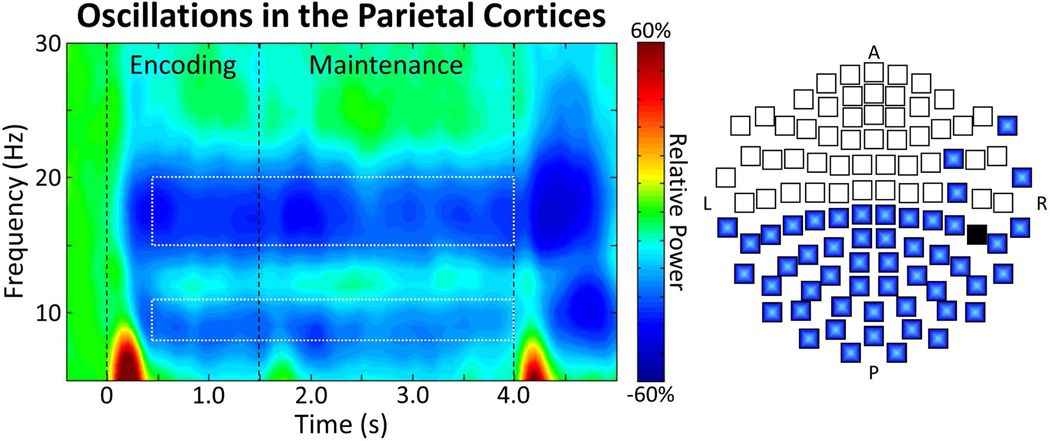
Figure 2.
Left: Time-frequency spectrogram with time (s) shown on the x-axis and frequency (Hz) denoted on the y-axis. Percent power change was computed for each time-frequency bin relative to the respective bin’s baseline power (−0.4 to 0.0 s). The color legend is displayed to the right of the spectrogram. Data represent a peak sensor, collapsed across loads and participants, located near the parietal cortices. Strong decreases in alpha and beta activity were observed following encoding onset, which were sustained throughout the remainder of encoding and maintenance. The time-frequency windows containing significant oscillatory responses relative to baseline activity (i.e., those selected for beamforming) are depicted by the white-dashed boxes. Right: A 2D map of the sensor array is shown, with blue sensors denoting those in which significant decreases in alpha and beta oscillations (i.e., the responses bounded by the white-dashed boxes) were observed. As shown, these responses were detected in gradiometers near occipital, parietal, and temporal regions. Note that the black sensor was not included in the sensor-level statistical analysis, as it was noisy in most participants.

