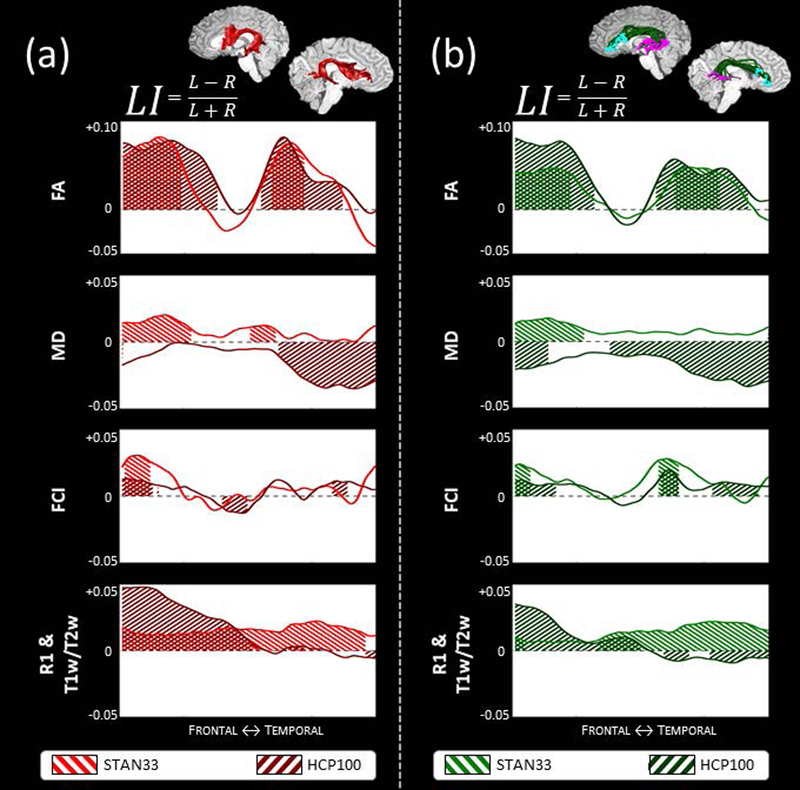
Figure 6.

Comparing arcuate microstructure laterality profiles between datasets. We compare the STAN33 and HCP100 datasets using both the DET arcuate (a) and the PROB constrained arcuate (b). We illustrate microstructure laterality for the diffusion measurements FA, MD and FCI and the non-diffusion measurements quantitative R1 (STAN33 data only) or semi-quantitative T1w/T2w (HCP100 data only). A positive LI score indicates a leftward asymmetry and a negative LI score indicates a rightward laterality, with shaded areas denoting segments along the profile that display statistically significant asymmetry, as calculated with a permutation test. See also Figs. A26–28.
