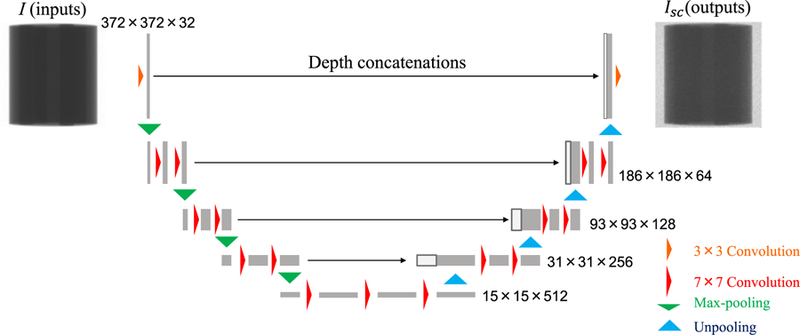
FIG. 4.

CNN architecture diagram. Yellow and red arrows represent 2D convolutional layers with filter size of 3 and 7, respectively. Green and light blue arrows indicate 2D max pooling and unpooling layers, respectively.

CNN architecture diagram. Yellow and red arrows represent 2D convolutional layers with filter size of 3 and 7, respectively. Green and light blue arrows indicate 2D max pooling and unpooling layers, respectively.