FIG. 6.

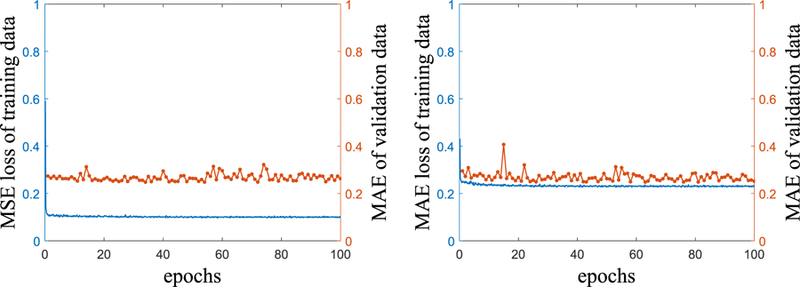
Training curves of the scenario 3 (left) and 4 (right). Solid blue lines are loss function values of training data, and dotted orange lines illustrate MAE values of the validation data during training.

Training curves of the scenario 3 (left) and 4 (right). Solid blue lines are loss function values of training data, and dotted orange lines illustrate MAE values of the validation data during training.