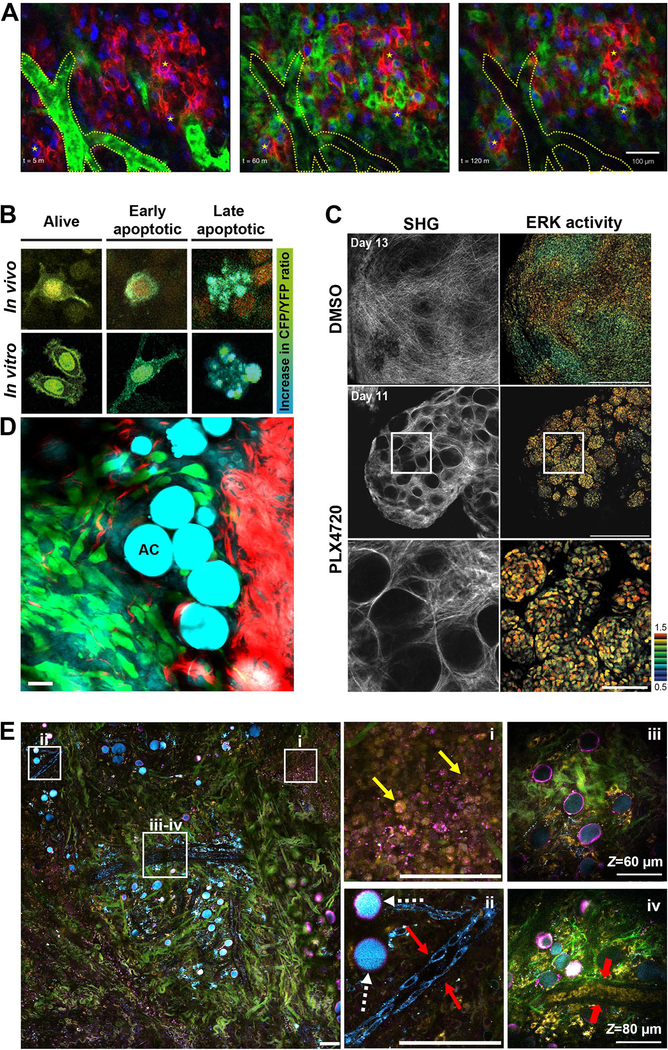
Figure 4. Translational potential of IV-MPM of cancer.
A) Imaging pharmacokinetics using fluorescently-labeled chemotherapeutics. IV-MPM images of a taxane-resistant HT1080 xenografts engineered to heterogeneously express MDR1-mApple (red) and ubiquitously express H2B-iRFP (blue). Intravenously injected BODIPY-mesylate (green) is dynamically monitored over the course of 2 hours. Blood vessels are segmented in dotted lines. Fiducial markers (stars) are placed for visual registration between frames. Scale bar, 100 μm. Reprinted with permission from [139]. B) Imaging pharmacodynamics. Representative images of cells in vitro and in vivo showing an increase in the CFP/YFP ratio of the Caspase-3 FRET biosensor as apoptosis progresses. Reprinted with permission from [142]. C) Imaging the role of the microenvironment in drug resistance. Representative IV-MPM images of ERK biosensor-expressing WM266.4 cells in nude mice treated with DMSO control (top panels) and PLX4720 (middle panels) for the indicated days. The high magnification images of the areas in white boxes are shown in bottom panels. In PLX4720-treated mice, there are “safe havens” of thick collagen fibers (SHG signal, left panels) containing tumor cells with high ERK activity (FRET biosensor, right panels). Scale bars, 500 μm (low magnification), 100 μm (high magnification). Reprinted with permission from [142]. D) Label-free imaging with combined 2-photon/coherent anti-Stokes Raman spectroscopy (CARS) microscopy. Direct interaction between adipocytes (AC, CARS, cyan) and tumor cells (exogenous labeling, green) during local invasion. SHG signal from collagen fibers is shown in red. Scale bar, 25 μm. Adapted and reprinted with permission from [173]. E) Label-free imaging of the tumor microenvironment using simultaneous label-free autofluorescence-multiharmonic (SLAM) microscopy. Pseudo-colored image of a 1.5 mm x 1.5 mm field of view of a rat mammary tumor showing collagen fibers (SHG signal, green), interfaces (THG signal, magenta), FAD (2P autofluorescence, yellow) and NADH (three-photon autofluorescence, cyan). The zoom-ins of boxed areas are displayed on the right. i, NADH signal allows visualization of tumor cells (yellow arrows). ii, Due to their shape, the FAD signal is stronger in macrophages (white dashed arrows) than in vascular endothelial cells (red arrows). iii-iv, the deeper z-sections of the area show a mature blood vessel containing red blood cells (red arrows). Adapted and reprinted with permission from [161].

