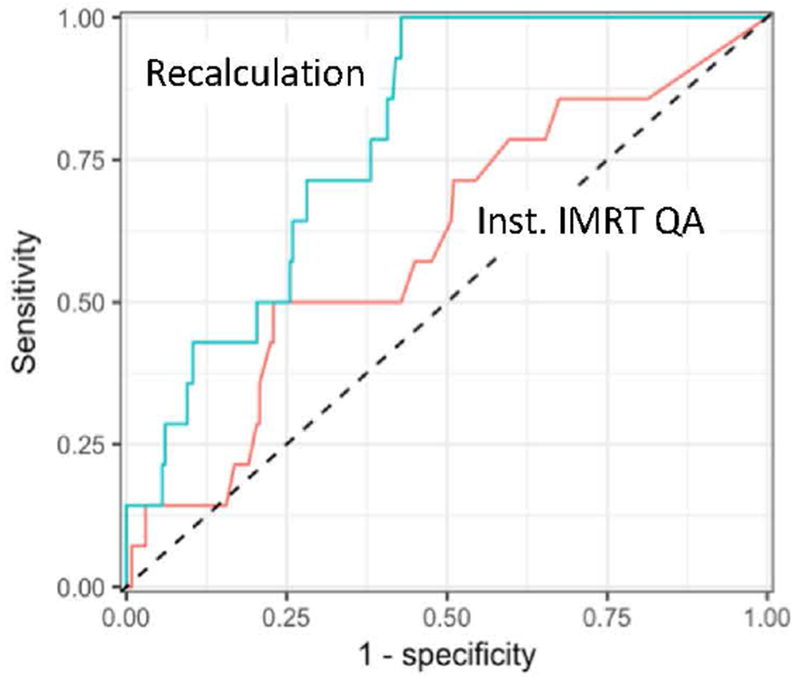
Figure 3.

ROC curves for the 245 phantom results evaluated by institutional IMRT QA using an array device and a 3%/3mm criterion. The upper line shows the ROC curve for this cohort evaluated using the IROC recalculation (AUC = 0.79) where the tolerance for dose disagreement in the PTV was varied. The lower line shows the ROC curve for this cohort evaluated using institutional IMRT QA (AUC = 0.60) where the percent of pixels passing gamma was varied. Sensitivity and specificity were relative to identification of phantoms that failed IROC criteria.
