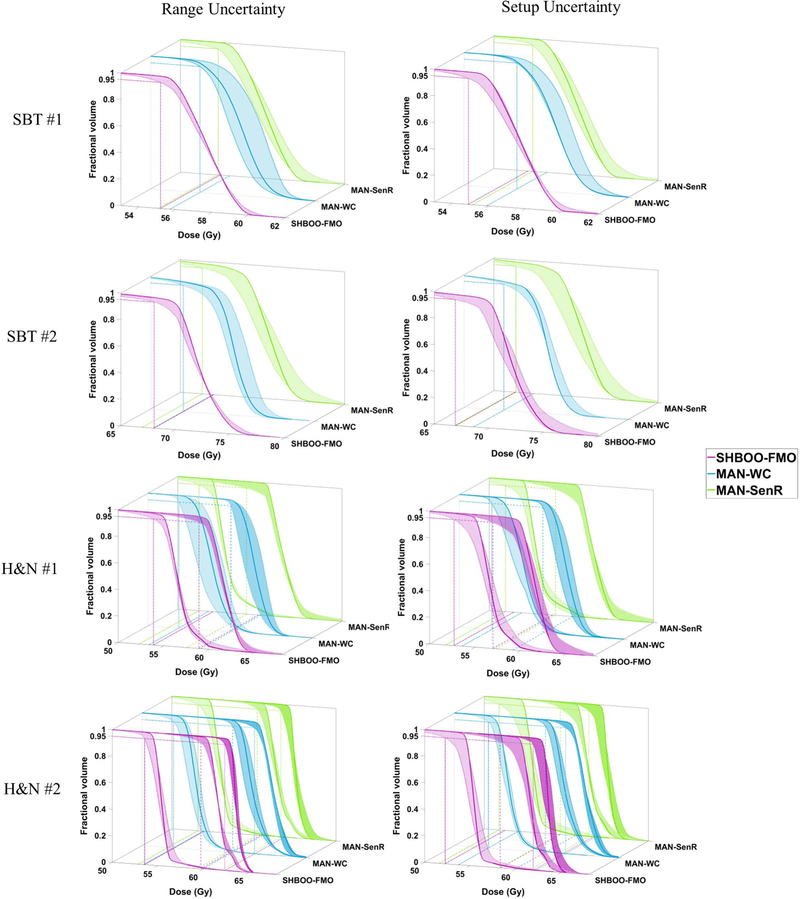
Figure 6.
CTV DVH bands of the four patients, indicating the robustness of the plans generated by SHBOO-FMO, MAN-WC and MAN-SenR. Situation with only range uncertainty is shown on the left and situation with only setup uncertainty is shown on the right. The two CTVs in the H&N #1 patient are plotted together in the third row, and the three CTVs in the H&N #2 patient are plotted together in two figures in the fourth row. The worst D95% of each method is labeled by reference lines in the x-y plane.

