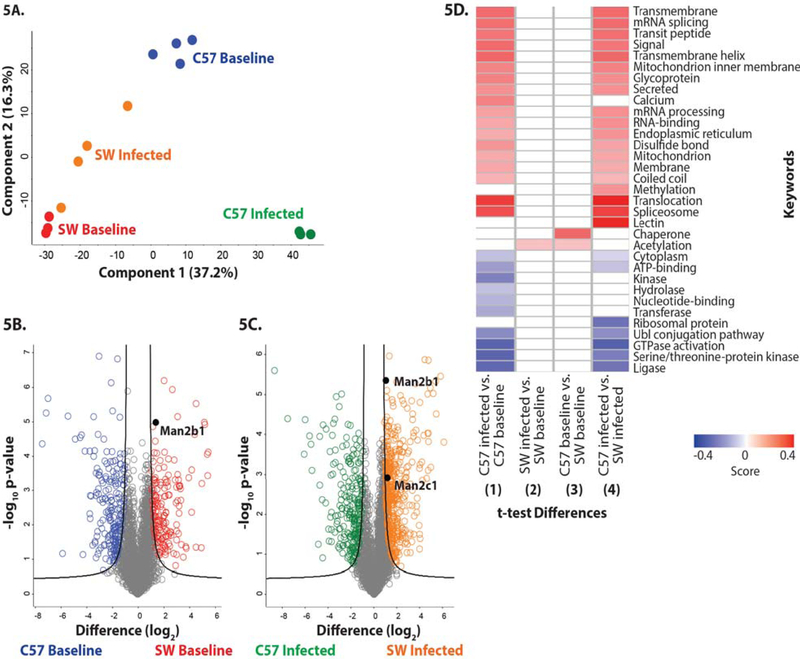
Figure 5. Differential protein abundance in SW and C57BL6/N-derived neutrophils from baseline and P. aeruginosa-infected mice.
(A) Principle component analysis representing the proteomes of samples harvested from neutrophils derived from non-infected SW (red) and C57BL/6 mice (blue), and infected SW (orange) and C57BL/6 (green) mice. Experiment was performed with a minimum of biological triplicates and measured on the mass spectrometer in two independent experiments. (B) Volcano plot depicting all identified proteins in neutrophils harvested from non-infected SW and C57BL/6 mice. The significantly different proteins with an increase in abundance at baseline in SW mice are shown in red, whereas those in the C57BL6-derived neutrophils are shown in blue. Data are representative from two independent experiments performed in at least biological triplicate. A Welch’s t-test was performed to determine significant differences in protein abundance (p-value < 0.05) using Benjamini-Hochberg FDR correction at 5%. The position of Man2b1 is highlighted. (C) Volcano plot depicting neutrophil proteomes from infected SW and C57BL/6 mice. The significantly different proteins with an increase in abundance during infection in SW mice are shown in orange, whereas those in the C57BL/6-derived neutrophils are shown in green. Data are representative from two independent experiments performed in at least biological triplicate. A Welch’s t-test was performed to determine significant differences in protein abundance (p-value < 0.05) using Benjamini-Hochberg FDR correction at 5%. The position of Man2b1 and Man 2c1 are highlighted. (D) 1D annotation enrichment profile based on keywords for comparisons among baseline and infected SW and C57BL/6-derived neutrophil samples. Data are representative from two independent experiments performed in at least biological triplicate. A two-sample Student’s t-test was performed (p-value < 0.05) using Benjamini-Hochberg FDR correction at 5% with scores between < −0.5 and < 0.5.

