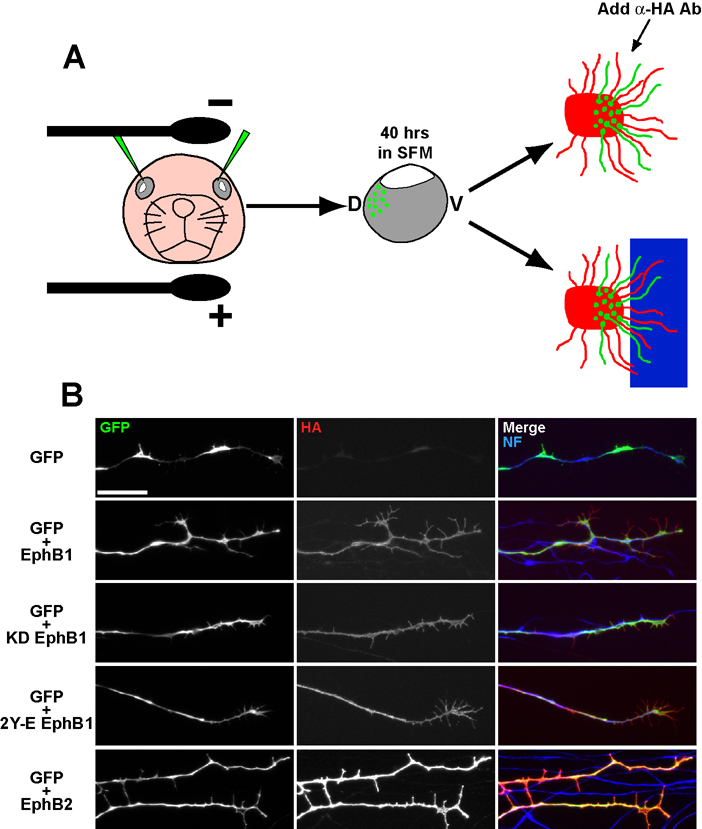
Figure 6. Ex vivo retinal electroporations reveal that EphB1 and EphB2 are expressed at different surface levels.
(A) Cartoon diagramming ex vivo retinal electroporation. DNA is injected into dorsal retina and electroporated. Retinae are removed and cultured in serum-free medium (SFM) for ~40 hours, and then explants are prepared from GFP+ retinal regions and plated on laminin (for live HA staining) or adjacent to ephrin-B2 substrate borders. (B) Live HA staining reveals that EphB2 is expressed at higher levels compared to RGC axons from EphB1, KD EphB1 and 2Y-E EphB1 electroporated retina. Scale bar = 20 µm.

