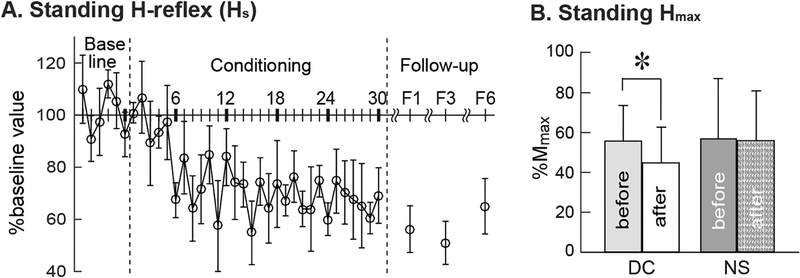
Figure 5.
A: Average (±SE) standing H-reflex values for baseline, conditioning, and follow-up sessions for the present DC group participants with SCI (N=6) in whom the late-swing phase H-reflex decreased significantly. Follow-up data are from all 6 participants for 1 month follow-up (F1) and from 4 for 3 and 6 months (F3 and F6) follow-up sessions. B: The Hmax during standing (mean±SD) was measured before and after 30 conditioning or control sessions.

