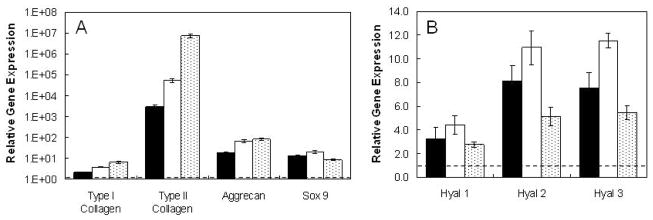
Figure 5. MSC-laden MeHA hydrogels in vivo.
Relative gene expression for type I and type II collagen, aggrecan, sox 9 (A) and hyaluronidases (B) for MSCs encapsulated in hydrogels cultured 2 weeks in vivo. GAPDH is used as the housekeeping gene and expression is normalized to cells at the time of encapsulation (indicated by the dashed line). The groups included the hydrogel alone (HA-MSC, black), hydrogels with TGF-β3 co-encapsulated with cells (HA+T3, white), and hydrogels pre-cultured in chondrogenic media for 2 weeks (HA-C, shaded). All groups are significantly different (p<0.05) for type I and II collagen, while HA-MSC is significantly different from both HA+T3 and HA-C for aggrecan. In addition, HA+T3 is significantly different from HA-C for Hyal 2 and 3 and sox 9.

