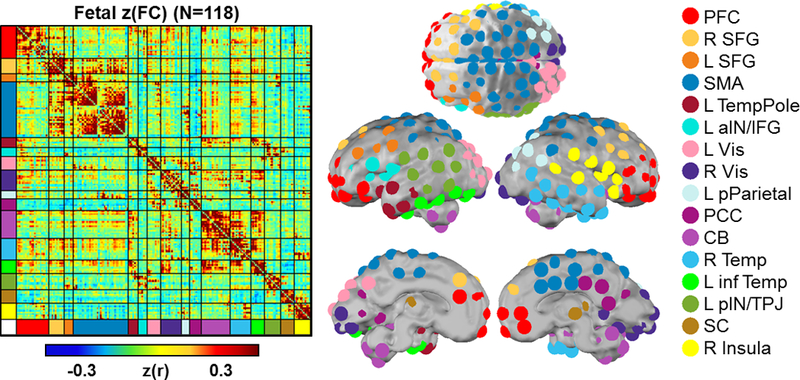
Figure 1. Networks of the fetal brain.

Networks were generated using functional connectivity data from 197 ROI acquired from 118 fetuses. The fetal connectome is mean Fisher-z-transformed Pearson-r correlation values between every pair of ROI. The spatial location of each ROI is displayed on the surface of the brain with coloring representative of the functional network assignments. PFC, prefrontal cortex; SFG, superior frontal gyrus; SMA, somatomotor area; aIN, anterior insula; IFG, inferior frontal gyrus; Vis, Visual; pParietal, posterior parietal; PCC, posterior cingulate cortex; CB, cerebellum; inf Temp, inferior temporal; pIN, posterior insula; TPJ, temporo-parietal junction; SC, subcortical grey matter. (For interpretation of the references to color in the figure legend, the reader is referred to the Web version of this article).
