
Figure 6. Associations between whole group gestational age (GA) and functional connectivity (FC).
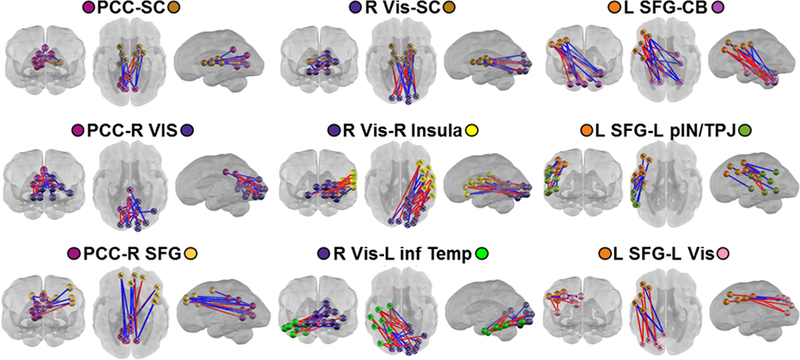
Blue lines represent negative FC-GA correlations, red lines represent positive FC-GA correlations. All connections between networks significant at Spearman rho p < 0.05. SFG, superior frontal gyrus; SMA, somatomotor area; aIN, anterior insula; IFG, inferior frontal gyrus; Vis, Visual; pParietal, posterior parietal; PCC, posterior cingulate cortex; CB, cerebellum; inf Temp, inferior temporal; pIN, posterior insula; TPJ, temporo-parietal junction; SC, subcortical grey matter. (For interpretation of the references to color in this figure legend, the reader is referred to the Web version of this article).