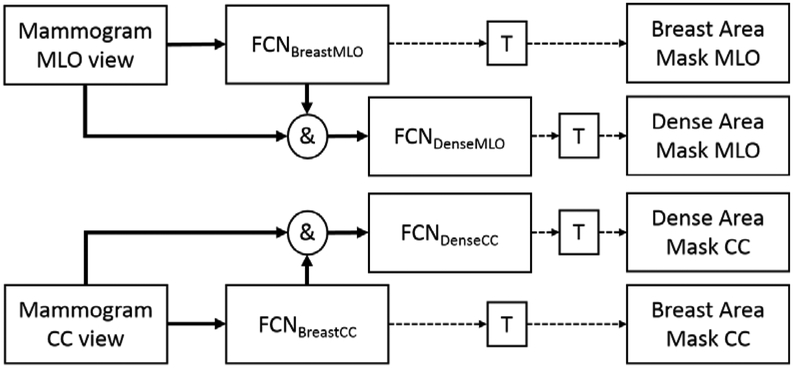
Figure 4.
This diagram summarizes the entire process of training, denoted as bold arrow lines, for the proposed algorithms, and how they create estimated breast area and dense area segmentations, denoted as dashed arrow lines. T refers to the thresholding to convert an estimated segmentation outcome in probability to binary masks. We used 0.5 for T. For breast area segmentation, we selected the largest blob in the resulting binary mask as breast area mask.

