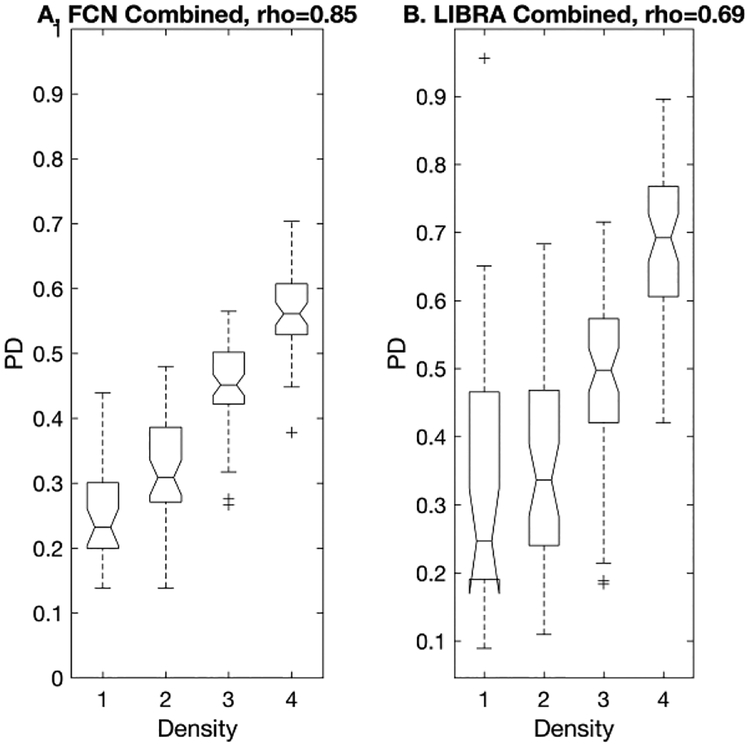
Figure 7.
This figure shows the box plots of the proposed algorithm and LIBRA for the case-based PD value, i.e., MLO and CC view averaged, verses BI-RADS breast density. The number of exams in each breast density category (density 1 – 4) are 15, 22, 28, and 26, respectively. The proposed algorithm showed higher correlation between the PD estimates and the BI-RADS density levels than LIBRA.

