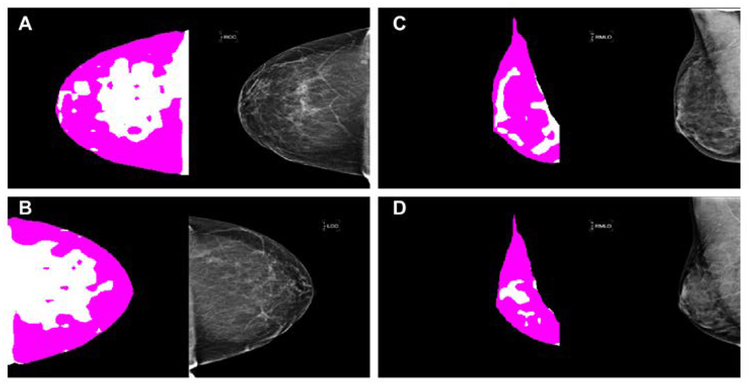
Figure 9.
This figure shows outliers that the proposed algorithm either over-segmented (A-B) or under-segmented (C-D) dense fibroglandular areas of the breast. A and B are the right and left CC mammogram views from the same woman with a BI-RADS density level 1. C and D are the right MLO mammogram views of two different women with a BI-RADS density level 4.

