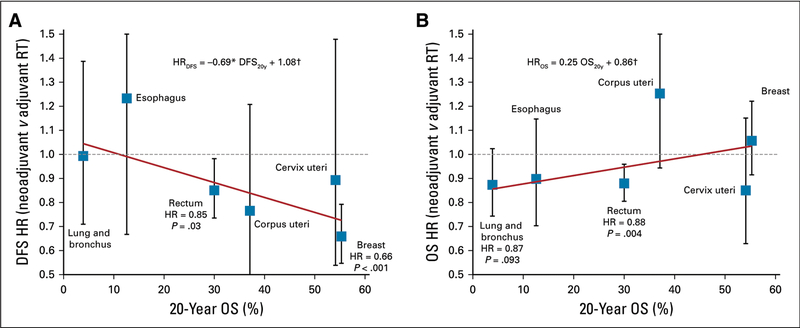
FIG A3.
Results of analysis using multivariable Cox proportional hazard model performed after propensity score matching of the adjuvant and neoadjuvant radiotherapy (RT) cohorts for each cancer site separately. Hazard ratios (HRs; with 95% CIs, P values, and trend lines obtained using linear least squares weighted by the inverses of site-specific CI lengths) for (A) disease-free survival (DFS) and (B) overall survival (OS) after preoperative (neoadjuvant) radiation (RS) compared with postoperative adjuvant radiation (SR). HRs were adjusted for age, sex, year of diagnosis, histology, type of surgery, type of applied radiation, and tumor size. Equation describes the trend line, and coefficients were tested for significant difference from 0 using t test. (*) P<.05. (†) P < .001.

