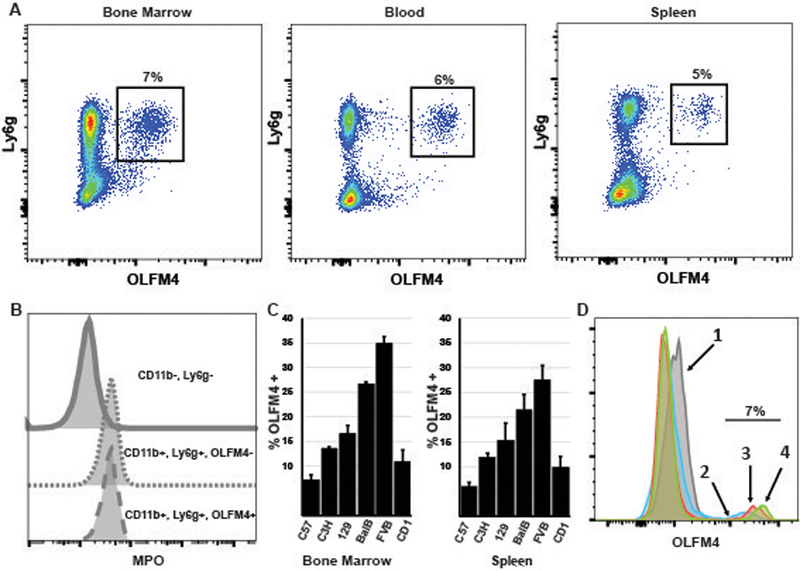
Figure 2. Only a subset of murine neutrophils express OLFM4.

A. Flow cytometry dot plot showing mouse bone marrow, blood, and spleen cells, gating on CD11b+ cells. OLFM4 expression can be see only in a subset of Ly6g+ cells (black box, percentage is of CD11b, Ly6g+ cells.) B. Histograms showing MPO intracellular staining is present in both OLFM4+ and OLFM4- neutrophils but not present in non-neutrophils (CD11b-, Ly6g-). C. Percentage of neutrophils that express OLFM4 from 6 common stains of mice. Both bone marrow and peripheral splenic CD11b, Ly6g+ neutrophils are shown. D. Histograms overlay of the four populations of maturing neutrophils from sort widows identical to those shown in figure 1c. Windows 2, 3, 4 are all have 7% OLFM4+ with increasing OLFM4 MFI.
