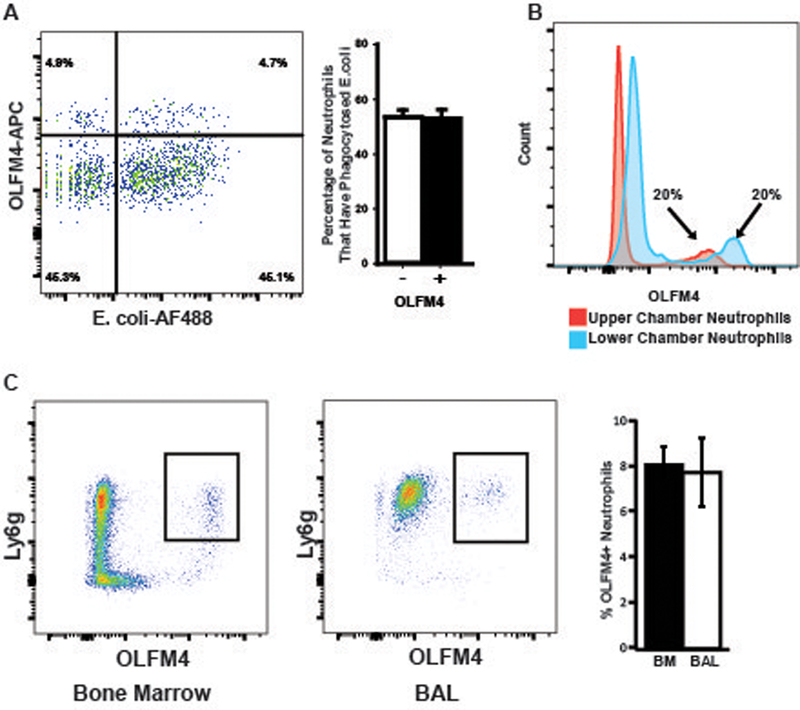
Figure 3. OLFM4+ and OLFM4- neutrophils phagocytose and migrate similarly.

A. Flow cytometric histogram of fixed bone marrow neutrophils following incubation with fluorescently labeled bacteria. B. Histogram showing percentage of OLFM4+ neutrophils in the upper and lower chambers of a transwell following 3 hours of incubation. Of note neutrophils in the lower chamber are exposed to higher concentration of fMLP and have higher OLFM4 MFI. C. Dot plots showing gated CD11b+ cells from the bone marrow and BAL 24 hours following treatment with intratracheal LPS.
