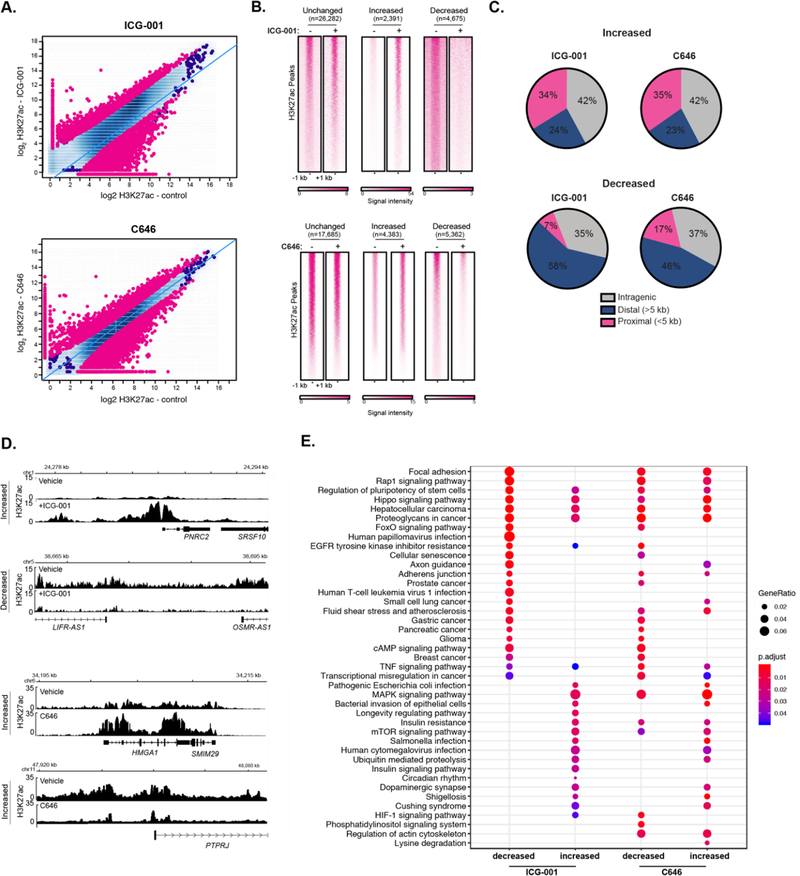
Figure 3.
Inhibitors of histone acetyltransferases impact global H3K27ac levels. (A) Differential H3K27ac enrichment analysis reveals significantly altered genome-wide H3K27ac sites in response to ICG-001 (Top) or C646 (bottom) treatment (FDR < 0.1), signal is represented as log2 normalized read count for the indicated condition. (B) Signal heatmaps representing the H3K27ac within altered regions after ICG-001 or C646 treatment identified from the differential analysis. (C) Location analysis of increased or decreased H3K27ac signal after treatment relative to gene regions. (D) Example of genes with increased or decreased H3K27ac signal after ICG-001 treatment; the signal is represented as fold enrichment over input. (E) KEGG pathway enrichment analysis of genes within altered regions after HAT inhibitor treatment.

