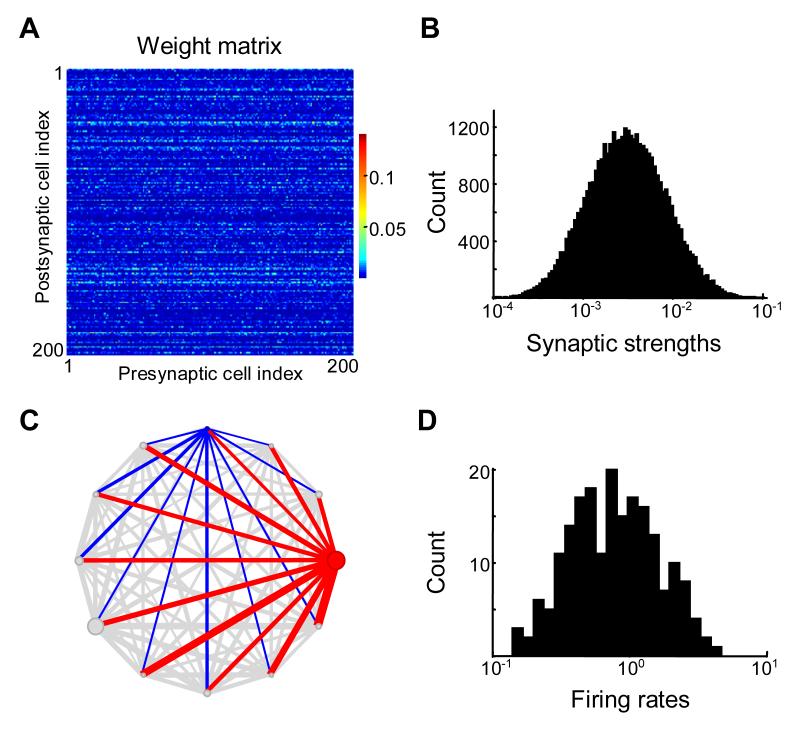
Figure 4.
Correlations among synaptic weights on the same dendrite (input correlations) lead to lognormal distribution of spontaneous firing rates.
(A) Synaptic connectivity matrix for 200 neurons. Note the horizontal “stripes” showing input correlations.
(B) Distribution of synaptic weights is set up to be lognormal.
(C) Inputs into two cells, red and blue are shown by the thickness of lines in this representation of the network. Because synaptic strengths are correlated for the same postsynaptic cell, the inputs into cells marked by blue and red are systematically different, leading to large differences in the firing rates. For the randomly chosen subset containing 12 neurons shown in this example the spontaneous firing rates (circle diameter) vary widely due to large variance in the strength of incoming connections (line widths).
(D) Distribution of spontaneous firing rates is lognormal and has a large variance for row-matrix.

