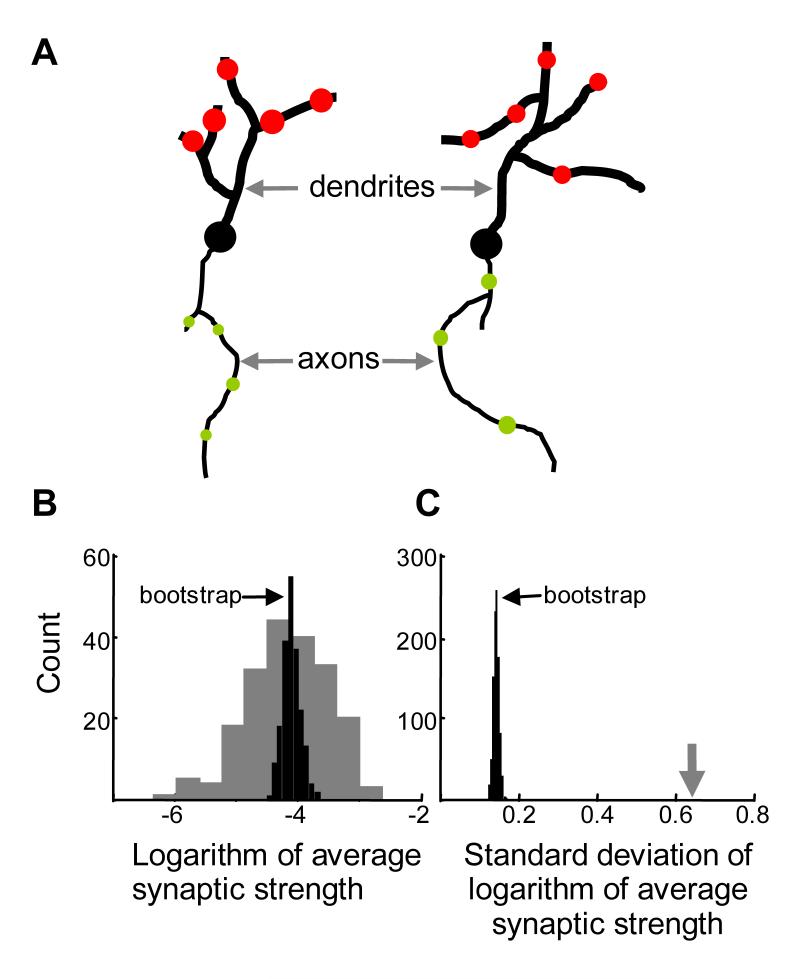
Figure 6.
Experimental predictions of this theory.
(A) The presence of row connectivity (Figure 4–5), sufficient for generation of dual lognormal distributions, implies correlations between synaptic strengths on each dendrite (the diameter of the red circle). In addition, if the non-linear Hebbian mechanism is involved in generation of these correlations, the synapses on the same axon are expected to be correlated (plaid-connectivity, Figure 5).
(B) To reveal these correlations, the logarithm of average synaptic strengths (LASS) was calculated for each dendrite. The distribution of these averages for individual dendrites (rows) from Figure 5 is shown by gray bars. The standard deviation of this distribution is about 0.64 in natural logarithm units. The black histogram shows LASS distribution after the synapses were “scrambled” randomly, with their identification with particular dendrites removed. This bootstrapping procedure (Hogg et al., 2005) builds a white-noise matrix with the same distribution of synaptic weights, but much narrower distribution of bootstrapped LASS.
(C) Distribution of standard deviations (distribution widths) of LASS for many iterations of bootstrap (black bars). The widths were significantly lower than the width of the original LASS distribution (0.64, gray arrow). This feature is indicative of input correlations.

