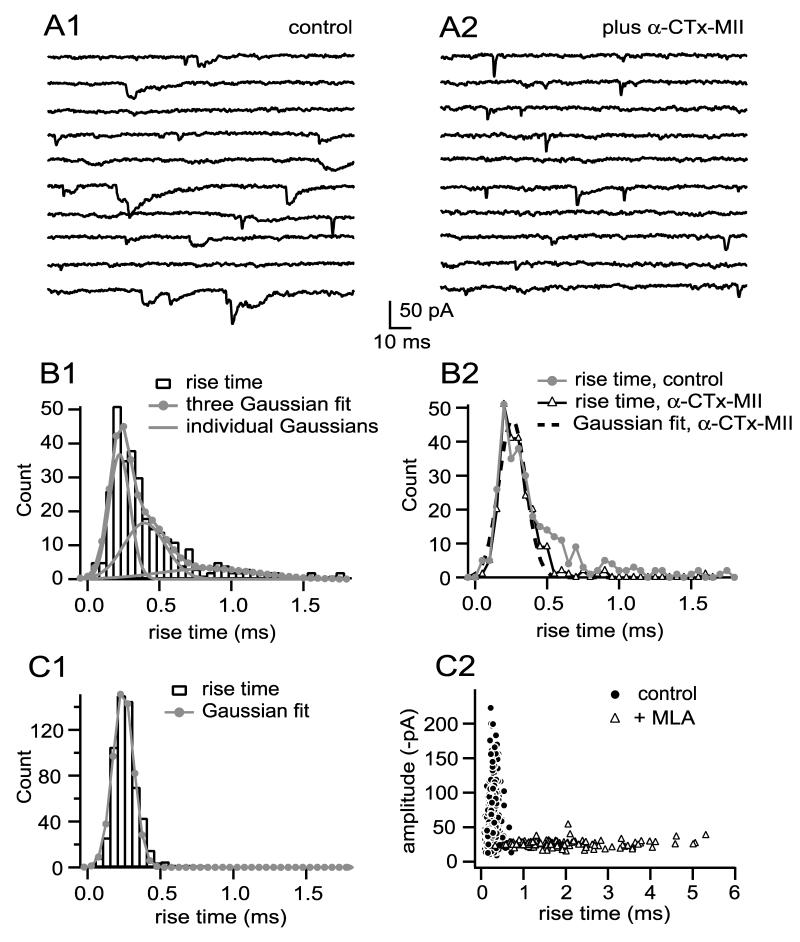
Figure 5.
MEPSCs arising from activation of α3-nAChRs are rare. A1 shows examples of mEPSCs recorded from a cell having a detectable population of slowly rising events (10 sequential responses). The probability density function of events can be fit with the sum of three Gaussians (B1), the slowest mode of which (0.86 ms) is comparable to that of pharmacologically isolated α3-nAChR mEPSCs. Blocking α3-nAChRs in this cell (A2) eliminated this population as well as a population of events having an intermediate rise (0.42 ms) to produce a distribution of rise times adequately fit by a single fast Gaussian having a mode of 0.28 ms (B2), similar to the fastest rise time mode before α-CTx MII (0.25 ms, B1). Across six cells, blocking α3-nAChRs reduced mEPSC amplitude by 14% (p=0.05 by paired t-test), reduced mEPSC rise time by 22% (p=0.007), and reduced mEPSC decay time by 43% (p=0.03). Only four cells of 14 had rise time probability density functions with a detectable population of slowly rising events (as in B1). C1 shows another cell with a rise time probability density function fit with a single Gaussian of 0.24 ms (n=577, p=0.99 by F-test); there is no suggestion of a population of α3-nAChR mEPSCs (compare to B1). An amplitude vs. rise time “fingerprint” of this cell before and after addition of MLA to block α7-nAChRs (C2) graphically illustrates that kinetically slow α3-nAChR mEPSCs, with a broad spectrum of rise times and a relatively narrow spectrum of amplitudes (open triangles), are not detected in the native population (closed circles). Across eight cells, blocking α7-nAChRs reduced detectable mEPSC amplitude by 53% (p=0.0008 by paired t-test), increased mEPSC rise time by 431% (p=0.0002), and increased mEPSC decay time by 351% (p=0.0003). See legend to Figure 3 for additional information regarding binning of rise time values.

