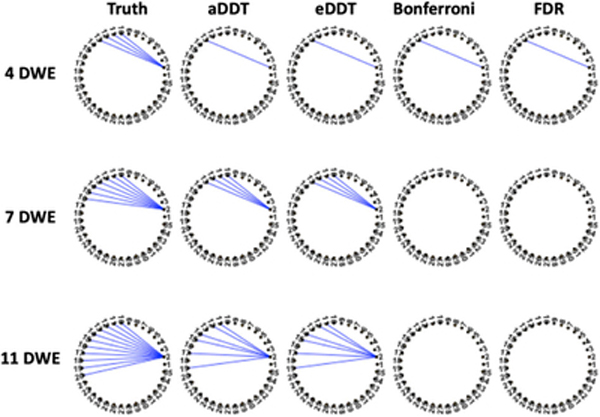
FIGURE 2.
Graphical illustration of the true contrasts containing 4, 7, and 11 DWEs incident to the node of interest for a random network of 35 regions. Blue edges are true positives detected by the respective method. The Bonferroni correction and FDR are underpowered to detect significant edges while the aDDT and eDDT estimates consistently detect the same set of significant edges. DDT, difference degree test; DWE, differentially weighted edge; FPR, false positive rate [Color figure can be viewed at wileyonlinelibrary.com]

