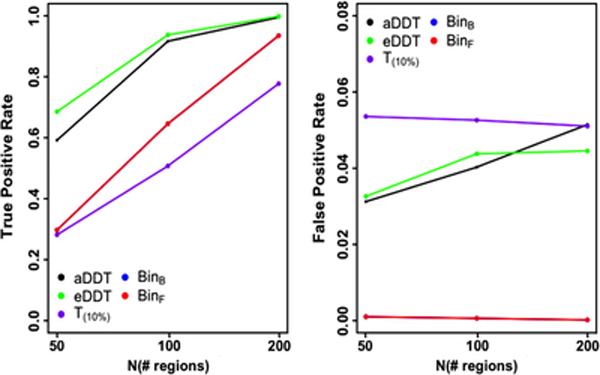
FIGURE 3.
Performance of aDDT, eDDT, t test(T10%), and binomial (BinB, BinF) tests in identifying the differentially connected node as the network size increases and the proportion of DWEs is fixed at 30%. (Note, the results of the BinB, BinF tests are very close and hence the two lines overlap) DDT, difference degree test; DWE, differentially weighted edge [Color figure can be viewed at wileyonlinelibrary.com]

