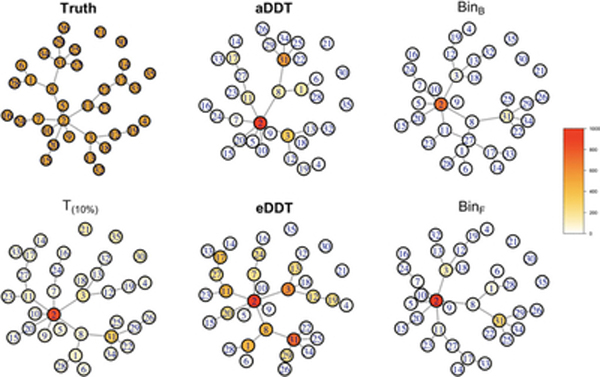
FIGURE 6.
Simulation results based on the setting in the NBS paper. The figure shows the true contrast structure (truth) where the edges in the contrast structure represent differentially weighted edges between groups. The figure shows the edges and nodes that are detected as differentially connected between groups based on the proposed aDDT, eDDT methods, and the existing t test (T(10%)) and binomial tests with multiple comparison corrections of Bonferroni and FDR (BinB, BinF). Nodes are color coded based on the number of times, it is selected as a differentially connected node across 1,000 simulations. DDT, difference degree test; FPR, false positive rate; NBS, network-based statistic [Color figure can be viewed at wileyonlinelibrary.com]

