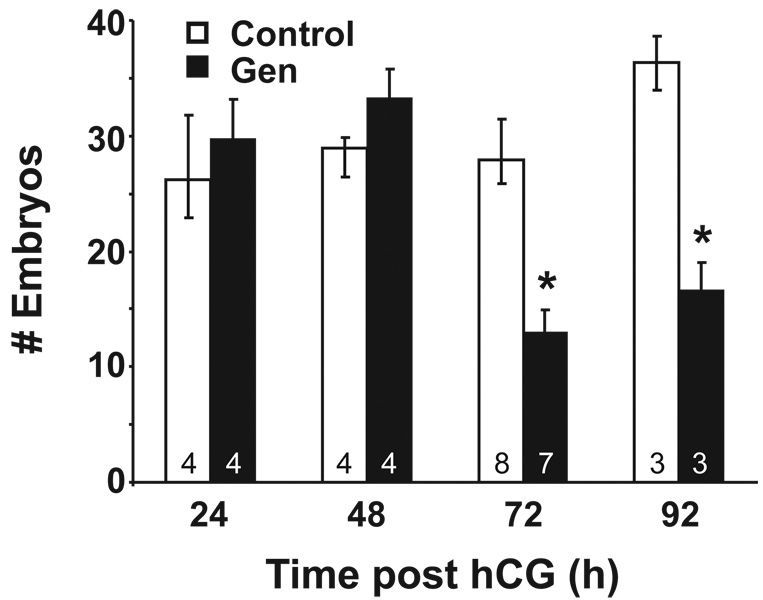
Figure 3.
Graph of embryo development over four days in vivo. The number of embryos retrieved (mean ± S.E.) from control or Gen-treated pregnant mice at 24, 48, 72 and 92 hrs post-hCG is shown. The number of mice per group is indicated at the base of the column. The asterisk denotes statistical significance at p<0.05 (Wilcoxon test).

