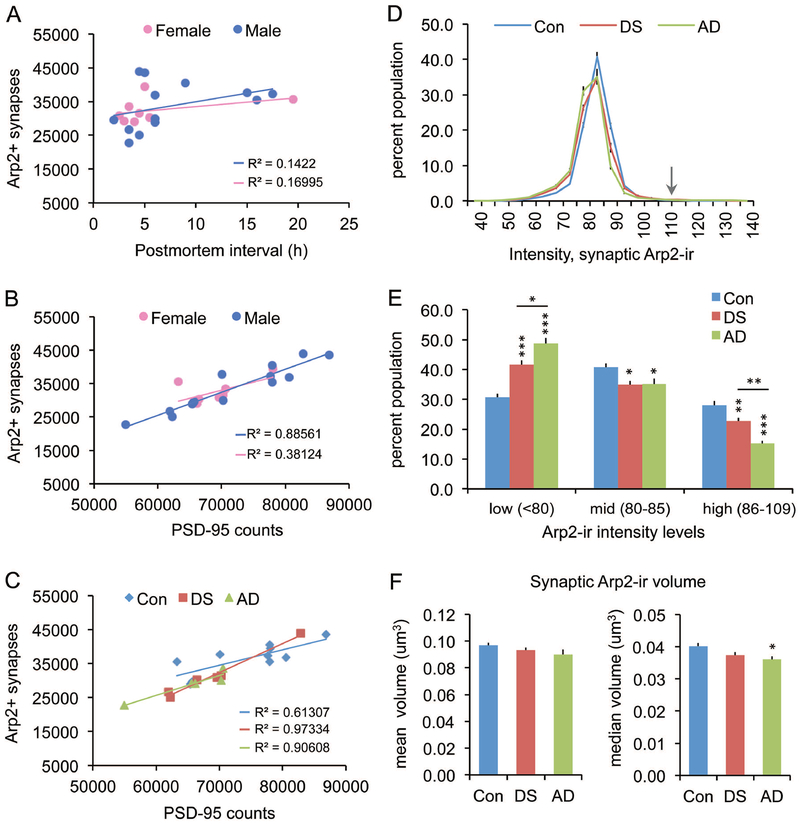
Figure 6.
Abnormalities in synaptic Arp2 levels are greater in AD than DS parietal cortex. (A-C) Numbers of Arp2+ synapses are unaffected by postmortem interval (PMI) or sex; all cases are presented in each panel. (A) Scatter plots show average counts per image field (42,840 um3) of Arp2+ synapses versus PMI for males and females; R2 values are low for each (p = 0.204 for males; p = 0.3201 for females). (B) Plots show positive correlations for numbers of Arp2+ synapses with total counts of PSD-95+ puncta in both sexes, although the correlation was significant for males (p < 0.0001) but not the females (p = 0.1029); notably, one female (control case, indicated by an asterisk) was an outlier, and it’s removal resulted in a significant correlation for the group (p = 0.002; R2 = 0.9467). (C) Plots show the same results presented in panel b but with all cases identified by group. All three groups had significant positive correlations between the two measures (p = 0.0003 for DS, p = 0.0126 for AD, p = 0.0074 for Con). (D) Plots show synaptic Arp2 immunolabeling intensity frequency distributions (expressed as a percent of total Arp2+ synapses) for control (Con), DS, and AD groups (group means ± SEM). Arrow indicates the 110 intensity threshold cutoff for statistical analyses. (E) Bar graph shows for each group the proportion of double-labeled synapses for which levels of Arp2-ir are in the low, middle (mid) and high intensity ranges (*p<0.05, **p<0.01, ***p<0.001 vs controls). The AD group exhibited a greater proportion of low vs high synaptic Arp2-ir compared to the DS group (*p<0.05, **p<0.01 for AD vs DS). (F) Bar graphs showing group mean (left) and median (right) ± SEM volumes for synaptic Arp2-ir; the median synaptic volume was significantly lower than Con for the AD group only (*p < 0.05).

