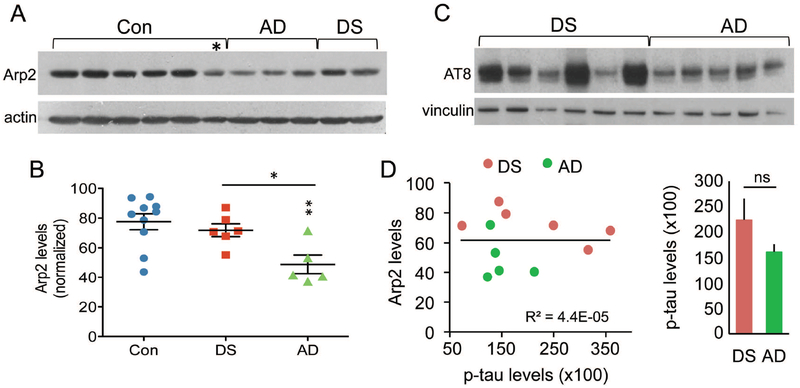
Figure 7.
Total levels of Arp2-ir in parietal cortex are lower than normal in AD but not DS. (A) Representative Western blot shows bands of Arp2-ir, and actin-ir from same blot, for 6 control (Con), 3 AD, and 2 DS cases; asterisk indicates one control case that had low Arp2 levels. (B) Scatter plots show levels of Arp2-ir for all cases in each group (normalized to actin for each sample); lines show group mean ± SEM values. The AD group had significantly lower total Arp2-ir levels than did Con (**p < 0.01) or DS (*p < 0.05) groups. (C) Western blot shows AT8-ir and vinculin-ir from same blot for DS and AD cases. (D) Left, plot shows relationship of Arp2-ir to phosphorylated tau-ir levels (using AT8 anti-sera) in the same sample field of parietal cortex for all DS and AD cases; these measures were not significantly correlated (p = 0.9845, Student’s t-test). Right, bar graph shows p-tau measures (mean ± SEM values) for DS and AD groups (ns, not significant).

