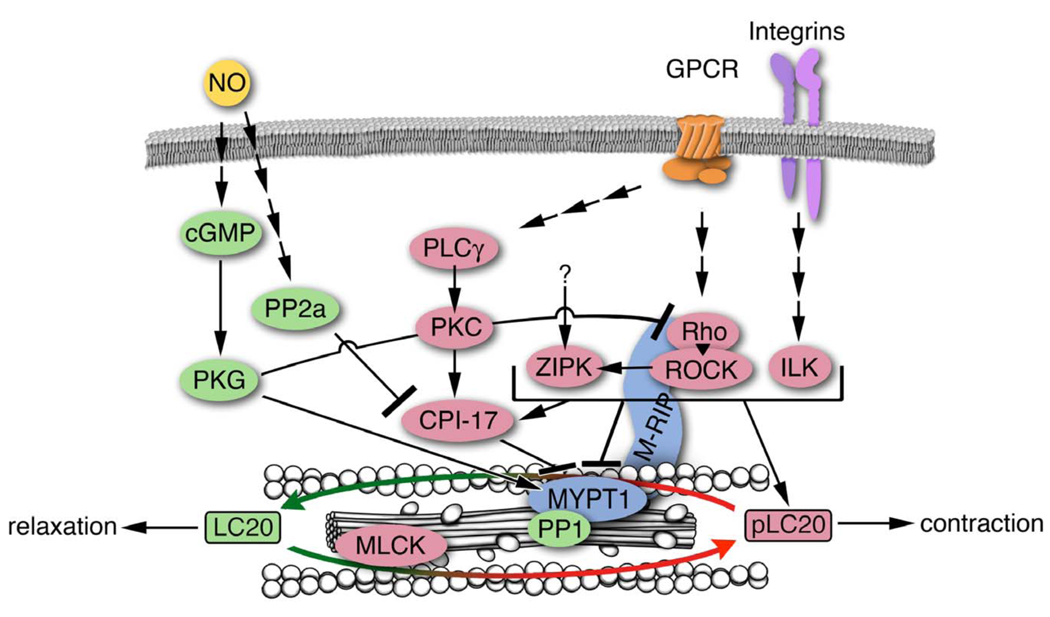
Figure 2. Regulatory pathways leading to myosin light chain phosphatase inhibition and activation.
Activating signaling molecules (leading to relaxation) are shown in green, inhibitory molecules (supporting contractility) are shown in pink. Molecules shown in blue are bimodal and can be both, an inhibitor or an activator.

